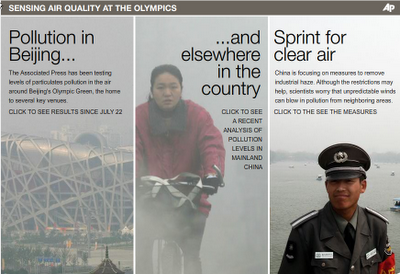
Recently Hong Kong was listed in the top 10 World's worst polluted cities.
For more on the air pollution in Hong Kong (current and past trends) click here. Also visit Civic Exchange, Hong Kong's independent think thank on energy and environmental issues for reports and publications on a variety of issues related Hong Kong.
An article on December 8th, 2010, by Corporate Social Responsibility Asia in Hong Kong had two outstanding speakers shedding light on the challenge – the one an impassioned environmentalist and the other a business leader. While Joanne Ooi, CEO of Clean Air Network and Tim Smith, CEO of Maersk Line in North Asia, could not have been more different in terms of their professional backgrounds, they shared similar views on how to tackle the problem of air pollution – through proactive business practices and engagement with governments to set necessary regulations. Read more @ CSR Asia.
Promoting the use of low sulfur fuel @ Hong Kong ports
This is an infomercial by Clean Air Network of Hong Kong.
A promotional video from the Government of Hong Kong to raise awareness on air pollution in the city and what the public can do.
Focus on Film... clips of public interviews on air pollution in Hong Kong
Thursday, December 09, 2010


Continuous Air Monitoring Stations (CAMS) in Delhi, India
Click on the links below for current ambient air quality levels at Delhi's four continuous air monitoring stations (CAMS) operated by the Central Pollution Control Board (CPCB)

@ Income Tax Office
@ Central Pollution Control Board
@ Delhi College of Engineering
@ Siri Fort Sports Complex
Click on the links below for current ambient air quality levels at Delhi's four continuous air monitoring stations (CAMS) operated by the Delhi Pollution Control Committee

@ Punjabi Bagh
@ Mandir Marg
@ R. K. Puram
@ Indira Gandhi International Airport
@ Civil Lines
***********
In the blog, on air pollution in Delhi

@ Income Tax Office
@ Central Pollution Control Board
@ Delhi College of Engineering
@ Siri Fort Sports Complex
Click on the links below for current ambient air quality levels at Delhi's four continuous air monitoring stations (CAMS) operated by the Delhi Pollution Control Committee

@ Punjabi Bagh
@ Mandir Marg
@ R. K. Puram
@ Indira Gandhi International Airport
@ Civil Lines
***********
In the blog, on air pollution in Delhi
- Air quality management in Delhi - Then, Now, and Next
- Delhi to be the first Indian city to forecast air quality
- Monitoring what we want to manage and mapping urban air pollution in Delhi
- Urban passenger travel statistics in India
- Pollution due to heavy duty trucks
- Photochemistry of air pollution in Delhi
- Why ban autorickshaws in Delhi?
- How to Estimate Transport Modal Shares Using Minimum Information - Case Study of Delhi
- Air pollution and health benefits of metro system in Delhi
- Air pollution in Delhi
- Beijing to Delhi - Traffic problems highlighted
- Need to push for public transport in India
Sunday, December 05, 2010
Air Pollution Alerts - December 5th, 2010

News & Information; Every Sunday
(Last on November 28th, 2010)
Boston Review, December, 2010
Can Technology End Poverty?
Philippine Star, December 5th, 2010
The air will no longer be free.
Business World, December 4th, 2010
For Better Transit in Mumbai.
Reuters, December 4th, 2010
Cities should step up climate change fight.
Focus Taiwan, December 3rd, 2010
Taiwan's air quality made worse by dust storm.
The National, December 3rd, 2010
Pollution could make Hong Kong's brain drain run faster.
Manila Bulletin, December 3rd, 2010
Gov't urged to prioritize renewable energy.
Business Enquirer, December 3rd, 2010
Economic growth can be sustainable.
New York Times, December 3rd, 2010
On Our Radar: Air Pollution Paralyzes Tehran.
UB Post, December 3rd, 2010
“Travelers”.
Manila Bulletin, December 3rd, 2010
Kuliglig cabs and pollution.
Delhi Go, December 2nd, 2010
Pollution levels moderate during CWG.
Americans for Energy Leadership, December 2nd, 2010
Why China Invests in Clean Energy.
McClatchy, December 2nd, 2010
What's missing in Mexico City? Dirty air.
Business World, December 2nd, 2010
Smarter cities:Invest for the future.
Foreign Policy, December 2nd, 2010
China's Coal Addiction.
Christian Science Monitor, December 1st, 2010
As host of Cancún climate talks, Mexico shows off its greener capital city.
Christian Science Monitor, December 1st, 2010
Air quality in Beijing is 'crazy bad,' but China still beats US in green investment.
TreeHugger, December 1st, 2010
Some U.S. Utilities Starting to Replace Coal with Natural Gas.
CNN, December 1st, 2010
Iran calls for public holiday as air pollution plagues capital.
Wall Street Journal, December 1st, 2010
California Pollution: Made in China?
Science Daily, November 30th, 2010
Worst Case Scenario: Can We Adapt to a World 2 to 4 Degrees Warmer?
PRI's The World, November 30th, 2010
The cost of coal in China.
Science Daily, November 29th, 2010
Charging for Plastic Bags Cut Bag Consumption by Half in China.
Times of India, November 30th, 2010
SUV owners should pay full market price of diesel.
National Academy Press, November 30th, 2010
Review of the Research Program of the FreedomCAR and Fuel Partnership.
Reuters, November 30th, 2010
Air pollution engulfs China's Shanghai after expo.
New York Times, November 29th, 2010
Breaking Away From Coal.
Daily Finance, November 29th, 2010
The 10 Cities With the World's Worst Air.
AlterNet, November 27th, 2010
Energy Companies' Big Plans to Exploit the American West to Feed China's Insatiable Appetite for Coal.
Times of India, November 26th, 2010
City's burgeoning vehicular strength.
National Geographic, September 21st, 2010
The Solvable Problem of Energy Poverty.
Friday, December 03, 2010
Commonwealth Games and Air Pollution in Delhi 2010
 Press coverage related to the air pollution in Delhi, leading up to the Commonwealth Games in October, 2010
Current air pollution levels at Delhi's four monitoring stations
- @ Income Tax Office
- @ Central Pollution Control Board
- @ Delhi College of Engineering
- @ Siri Fort Sports Complex
Current air pollution forecasts for Delhi are here.

*********
Delhi Go, December 2nd, 2010
Pollution Levels Moderate During the CWG.
Hindustan Times, October 23rd, 2010
Read the weather forecast? Now, read about air quality.
Indian Express, October 22nd, 2010
Check air quality at a click of a mouse!
Sify News, October 22nd, 2010
Air quality forecast system in Delhi.
Times of India, October 22nd, 2010
Fog arrives, pollution leads to haze in Delhi.
Deccan Herald, October 22nd, 2010
Know about air quality of any place at a click of a mouse.
Hindustan Times, October 20th, 2010
Games over, pollution back.
Indian Express, October 12th, 2010
Pollution levels headed south.
Times of India, October 12th, 2010
Delhi’s air quality worsens, haze over city.
Economic Times, October 11th, 2010
Air at Games Village, venues polluted.
Hindustan Times, October 11th, 2010
32 killed as China suffers its worst pollution day.
The Hindu, October 10th, 2010
Games lanes may be here to stay.
Times of India, October 7th, 2010
Delayed transport contract led to OC's transport mess.
Indian Express, October 6th, 2010
Bad food to ignorant drivers: On Day 2 of Games, the complaint book looks full.
Indian Express, October 6th, 2010
Traffic police restrict entry of goods vehicles.
Times of India, October 5th, 2010
Traffic police site to give updates on roadblocks.
Hindustan Times, October 4th, 2010
Just click for data on traffic congestion, routes in Delhi.
Indian Express, October 4th, 2010
A Great Indian Start to Games.
NDTV, October 1st, 2010
CWG organisers in the past too faced criticism.
Times of India, September 24th, 2010
CO in Delhi air prime concern.
Wall Street Journal, September 24th, 2010
Can Delhi Pull Off the Commonwealth Games?
Times of India, September 23rd, 2010
Diesel gensets draw ire of green activists.
InfoChange, September, 2010
Public transport vs personalised transport in India.
The Hindu, September 18th, 2010
A depot for 1,000 buses for the Games.
Samay Live, September 14th, 2010
CWG traffic trials trouble commuters.
Times of India, September 9th, 2010
IITM ready with Delhi's air pollution report.
DNA India, September 6th, 2010
Don't allow black-and-yellow cabs to fade out.
Down to Earth, August 31st, 2010
Car Control.
US EPA, August 31st, 2010
EPA and NOAA scientists test tools’ ability to forecast local ozone.
Times of India, August 30th, 2010
International cycling event touted as CWG trial flops.
Indian Express, August 29th, 2010
During Commonwealth Games, devices to measure pollution levels.
MSN India, August 28th, 2010
During Commonwealth Games, devices to measure pollution levels.
India News, August 25th, 2010
CPCB can now access air quality data of NTPC power units via web.
Times of India, August 25th, 2010
Delhi sees major traffic jam, water-logging.
Press India Bureau, August 24th, 2010
Effects of Introduction of Gaseous Fuels for Public Transport.
Indian Express, August 24th, 2010
Colour code for air quality: meter designed in city is ready for CWG.
Press Information Bureau, August 24th, 2010
Emission Norms for Petrol & Diesel Vehicles in India.
Hindustan Times, August 16th, 2010
Pollution alert system ready to be launched.
Hindustan Times, August 13th, 2010
Capital's cold Bed & Breakfast.
Times of India, August 12th, 2010
Marred by delays, Delhi comes clean on air.
India Infoline, August 10th, 2010
Shiela Dikshit flags-off E-rick in New Delhi.
Times of India, August 6th, 2010
What your car costs the city.
Times of India, August 6th, 2010
Crackdown on polluting vehicles.
The Pioneer, July 28th, 2010
Sheila’s cracker fatwa on Games eve.
Live Mint, July 18th, 2010
Ideology vs reality in transportation.
Times of India, July 16th, 2010
CWG 2010: Cautiously Optimistic.
Express India, July 15th, 2010
Rain clears air, Delhi hopes trick works for Games too.
Indian Express, July 13th, 2010
Trucks to be kept out of Delhi during Games.
India Today, July 12th, 2010
Vehicles revving up Delhi flyovers double noise pollution level.
Hindustan Times, July 9th, 2010
Let’s get the basics right.
Live Mint, July 5th, 2010
The liberalization fix to Delhi’s demonic traffic.
Times of India, July 2nd, 2010
Delhi world's 5th most painful city for drivers.
Sify Sports, June 30th, 2010
Air quality monitoring system for Commonwealth Games by July-end.
Hindustan Times, June 24th, 2010
100 days left, Delhi gets its act together for Commonwealth Games.
My News, June 6th, 2010
Delhi Chief Minister releases State of Environment report.
Times of India, June 7th, 2010
Vendors to be evicted in Games clean-up.
Times of India, June 2nd, 2010
Govt plans to hide unfinished Games work behind curtains.
Down to Earth, June, 2010
Delhi's Wake Up Call.
Times of India, June 5th, 2010
Every Breath You Take.
Indian Express, May 26th, 2010
Polluting Industrial Units Ordered to Close in Nangloi, Delhi, India.
The City Fix, May 25th, 2010
Socially Responsible Business for India’s Auto Rickshaws.
The City Fix, May 24th, 2010
NyayaBhoomi: Champion for Delhi’s Auto Rickshaws.
Times of India, May 21st, 2010
Now, you can drive faster on Delhi roads.
Mid Day, May 17th, 2010
Look up and know the air Delhi breathes.
Center for Science & Environment, May 15th, 2010
Delhi agrees to use Commonwealth Games as an opportunity to address air quality concerns.
Environmental Research Web, May 12th, 2010
Delhi congestion delimited.
Hindustan Times, May 11th, 2010
Delhi may ban NCR vehicles during Games.
Hindustan Times, May 11th, 2010
Air’s the truth, Delhi air can turn you sick.
DNA India, May 10th, 2010
Air pollution could hit performance of athletes in Commonwealth Games.
The Star, May 10th, 2010
Delhi’s air pollution may take athletes’ breath away.
The Tribune, May 10th, 2010
Green Games: Delhi has lots of cleaning to do Pollution levels rising, could hit athletes’ performance.
Hindustan Times, May 10th, 2010
Air pollution could hit performance of athletes in CWG.
Press Information Bureau, April 23rd, 2010
Common Transport Agreement for Unrestricted Movement of Vehicles in NCR Delhi.
Hindustan Times, April 6th, 2010
WHO praises Delhi govt for curbing pollution.
Indian Express, March 18th, 2010
Sheila wants autos off Delhi roads.
The Guardian, March 18th, 2010
Delhi plans ban on autorickshaws.
Times Online, March 16th, 2010
Delhi officials unveil giant public air freshener to scrub atmosphere clean.
The National, January 21st, 2010
Commonwealth Games bring more pollution to Delhi.
Meri News, February 14th, 2010
Delhi's pollution: A major concern.
Times of India, February 11th, 2010
Delhi HC moots congestion fee on cars.
News Center, February 10th, 2010
Vedanta 'pollutes' air, water in India's Amnesty.
India, February 7th, 2010
Delhi's deadly air pollution forces detour for Kiwi athletes.
Times of India, January 27th, 2010
City pedals green cause, to promote cycle tracks in Delhi.
New York Times, January 25th, 2010
Delhi to Ditch Coal for Natural Gas.
India Press Information Bureau, January 22nd, 2010
Trends of Air Pollution in Delhi.
India Press Information Bureau, January 22nd, 2010
Source Apportionment Studies.
Clean Techniqa, January 1st, 2010
New Delhi Contemplates Closing Down Industrial Units for ‘Clean’ Commonwealth Games 2010.
Thaindian, December 31st, 2009
2010 dawns, but Delhi unprepared for Commonwealth Games.
Times of India, December 25th, 2009
5 out of India's 20 worst pollution zones in National Capital Region.
Indian Express, December 19th, 2009
New air pollution norms tough to meet.
Hindustan Times, December 9th, 2009
Carbon map shows Delhi emissions low.
Times of India, December 4th, 2009
BRTS Ahmedabad has learnt from Delhi's mistakes.
Wheels Unplugged, November 16th, 2009
Delhi first Indian city to switch to ultra low sulphur diesel from April 2010.
Times of India, November 10th, 2009
Cars, construction polluting air in Delhi, India.
Times of India, November 7th, 2009
Delhi smog normal winter phenomenon, not Jaipur fire fallout.
The Telegraph, November 7th, 2009
Smog envelops capital - Concern shifts from fuel to number of vehicles in Delhi, India.
Times of India, November 1st, 2009
Delhi air may trouble athletes during Commonwealth Games.
Public Information Bureau, November 4th, 2009
Delhi Metro is the Proudest Achievement of Modern India.
Times of India, October 15th, 2009
Delhi wastes Rs 11.5cr in traffic jams daily.
Indian Express, October 5th, 2009
Capital pollution check in Delhi.
Times of India, September 26th, 2009
Delhi limps behind in walkability index.
Business Standard, September 2nd, 2009
Reinventing Delhi: Cutting the Gordian Knot.
Times of India, August 27th, 2009
No-pollution three wheelers unveiled in New Delhi.
Granta Magazine, August 29th, 2009
Capital Gains - Story of Delhi, India.
India Express, July 31st, 2009
Chennai Metro: Will imitating Delhi help?
Dehli Struggle, July 23rd, 2009
Why delhi’s buses are so deadly: an economic analysis.
One India, April 23rd, 2006
Transport in Asian cities and air pollution in New Delhi.
India Express, June 1st, 2009
Can Delhi come clean before Games 2010?
***********
In the blog, on air pollution in Delhi
- Analysis of air quality index for Delhi, India
- Air quality management in Delhi - Then, Now, and Next
- 7 measures to implement for better air during CWG 2010 (CSE)
- Delhi to be the first Indian city to forecast air quality
- Monitoring what we want to manage and mapping urban air pollution in Delhi
- Urban passenger travel statistics in India
- Pollution due to heavy duty trucks
- Photochemistry of air pollution in Delhi
- Why ban autorickshaws in Delhi?
- How to Estimate Transport Modal Shares Using Minimum Information - Case Study of Delhi
- Air pollution and health benefits of metro system in Delhi
- Air pollution in Delhi
- Beijing to Delhi - Traffic problems highlighted
- Need to push for public transport in India
Tuesday, November 30, 2010
New Delhi and Beijing Tied for the World City with the Worst Air Quality
This list of World's worst polluters is published in Daily Finance on November 29th, 2010
List goes as
(1) Beijing, China
(1) New Delhi, India
(3) Santiago, Chile
(4) Mexico City, Mexico
(5) Ulaanbaatar, Mongolia
(6) Cairo, Egypt
(7) Chongqing, China
(8) Guanzhou, China
(9) Hong Kong, Hong Kong
(10) Kabul, Afghanistan
Top 100 cities with the worst air quality in the World (WHO, 2011)
General arguments aside that the ratings depend on what the parameters are, reliability of the information used for this ranking, and how the rating system is defined, it is sad to see cities like Kabul and Ulaanbaatar on the list - with least population compared to the rest of the cities in Top 10.
Of the ten, four were in news for hosting the biggest sports events
Beijing for the Olympic Games (2008)
Hong Kong for the East Asian Games (2009)
Delhi for the Commonwealth Games (2010)
Guanzhou for the Asian Games (2010)
Questions - Hong Kong (city is a good public transport system) is worse than any of the other cities not listed here - Dhaka, Hanoi, Shanghai, Hyderabad, Kolkata, Manila?
**************
Published in Daily Finance
With the latest round of global climate change talks set to begin this week in Cancun, Mexico, the assembled delegates should be thankful they're not meeting in, say, Beijing or New Delhi. Those two cities are tied at the top of a list no city should want to be on: those with the world's worst air quality.
Indeed, one reason -- beyond melting glaciers and rising sea levels -- that nations are meeting again to try to hammer out some consensus on what to do about earth's deteriorating climate is that the very air we're breathing is dangerous. Some of the world's largest and most densely populated cities have air that's so polluted that people suffer from lung diseases at rates that are orders of magnitude above global averages. Birth defects in these cities are also at extraordinarily high levels, as are heart disease and cancer rates.
List goes as
(1) Beijing, China
(1) New Delhi, India
(3) Santiago, Chile
(4) Mexico City, Mexico
(5) Ulaanbaatar, Mongolia
(6) Cairo, Egypt
(7) Chongqing, China
(8) Guanzhou, China
(9) Hong Kong, Hong Kong
(10) Kabul, Afghanistan
Top 100 cities with the worst air quality in the World (WHO, 2011)

General arguments aside that the ratings depend on what the parameters are, reliability of the information used for this ranking, and how the rating system is defined, it is sad to see cities like Kabul and Ulaanbaatar on the list - with least population compared to the rest of the cities in Top 10.
Of the ten, four were in news for hosting the biggest sports events
Beijing for the Olympic Games (2008)
Hong Kong for the East Asian Games (2009)
Delhi for the Commonwealth Games (2010)
Guanzhou for the Asian Games (2010)
Questions - Hong Kong (city is a good public transport system) is worse than any of the other cities not listed here - Dhaka, Hanoi, Shanghai, Hyderabad, Kolkata, Manila?
**************
Published in Daily Finance
With the latest round of global climate change talks set to begin this week in Cancun, Mexico, the assembled delegates should be thankful they're not meeting in, say, Beijing or New Delhi. Those two cities are tied at the top of a list no city should want to be on: those with the world's worst air quality.
Indeed, one reason -- beyond melting glaciers and rising sea levels -- that nations are meeting again to try to hammer out some consensus on what to do about earth's deteriorating climate is that the very air we're breathing is dangerous. Some of the world's largest and most densely populated cities have air that's so polluted that people suffer from lung diseases at rates that are orders of magnitude above global averages. Birth defects in these cities are also at extraordinarily high levels, as are heart disease and cancer rates.
Many of these cities are among the fastest-growing in the world. And in some, residents burn wood and coal for warmth, releasing additional deadly pollution into the atmosphere.
But which cities have the world's worst air? To compile such a list, 24/7 Wall St. has reviewed several dozen studies on air quality conducted over the past few years, along with data from government websites and private sources. Our review examined data about the following pollutants:
But which cities have the world's worst air? To compile such a list, 24/7 Wall St. has reviewed several dozen studies on air quality conducted over the past few years, along with data from government websites and private sources. Our review examined data about the following pollutants:
- Sulfur dioxide: Produced when fossil fuels are burned and is the primary cause of acid rain. Exposure causes eye irritation, coughing, worsening of asthma and respiratory-tract infections.
- Nitrogen dioxide: Produced by generators, power plants and motor vehicles. It has been shown to cause bronchitis and other pulmonary diseases.
- Particulates: Refers to a variety of small pollutants, including lead, dust, ammonia, soot and pulverized minerals. They're a leading cause of lung cancer. According to the World Health Organization (WHO), mortality in cities with high levels of particulates "exceeds that observed in relatively cleaner cities by 15% to 20%."
With that background, here are 24/7's 10 cities with the worst air quality:
1) Beijing, China (tie)
Beijing's air quality has become so bad that the city has recently been engulfed in a hazardous haze (pictured above). As a result, schools have been forced to cancel outdoor activities, and health experts have asked that children, the elderly and people with respiratory ailments stay indoors. The city recorded the world's highest level of sulfur dioxide concentrations for 2000 to 2005 and has the third-highest level of nitrogen dioxide behind only Sao Paulo and Mexico City. Pollution improved in 2008 because officials banned roughly half of the city's cars when it hosted the Olympic Games. Of course, the air got worse again after the games left town.
Beijing's air quality has become so bad that the city has recently been engulfed in a hazardous haze (pictured above). As a result, schools have been forced to cancel outdoor activities, and health experts have asked that children, the elderly and people with respiratory ailments stay indoors. The city recorded the world's highest level of sulfur dioxide concentrations for 2000 to 2005 and has the third-highest level of nitrogen dioxide behind only Sao Paulo and Mexico City. Pollution improved in 2008 because officials banned roughly half of the city's cars when it hosted the Olympic Games. Of course, the air got worse again after the games left town.
1) New Delhi, India (tie)
According to WHO's most recent findings, New Delhi ranks second in concentrations in particulates, at a level more than six times higher than what WHO considers safe. According to the Harvard International Review, two in every five of the city's 13.8 million residents suffer from respiratory illness. The report says the main cause of New Delhi's air pollution is car exhaust and dust kicked up from overcrowded roads. As a result, construction workers and taxi drivers are most at risk for debilitating illness or even early death.

According to WHO's most recent findings, New Delhi ranks second in concentrations in particulates, at a level more than six times higher than what WHO considers safe. According to the Harvard International Review, two in every five of the city's 13.8 million residents suffer from respiratory illness. The report says the main cause of New Delhi's air pollution is car exhaust and dust kicked up from overcrowded roads. As a result, construction workers and taxi drivers are most at risk for debilitating illness or even early death.
3) Santiago, Chile
According to WHO, a city's airborne particulate matter should not exceed 50 micrograms per cubic meter. In Santiago, an alert is issued when the level hits 200 micrograms. In 2008, on some days the city reached 444 micrograms. Additionally, Santiago has the second-highest level of ground-level ozone, according to WHO.
According to WHO, a city's airborne particulate matter should not exceed 50 micrograms per cubic meter. In Santiago, an alert is issued when the level hits 200 micrograms. In 2008, on some days the city reached 444 micrograms. Additionally, Santiago has the second-highest level of ground-level ozone, according to WHO.
4) Mexico City, Mexico
According to researchers from the University of Salzburg, Mexico City has high concentrations of nearly every major harmful airborne pollutant, including sulfur dioxide, nitrogen oxides and carbon monoxide. By far the worst problem gripping the city is the massive cloud of smog that hangs over it almost every day. Mexico City has the highest level of ground-level ozone in the world, according to WHO.
According to researchers from the University of Salzburg, Mexico City has high concentrations of nearly every major harmful airborne pollutant, including sulfur dioxide, nitrogen oxides and carbon monoxide. By far the worst problem gripping the city is the massive cloud of smog that hangs over it almost every day. Mexico City has the highest level of ground-level ozone in the world, according to WHO.
5) Ulaanbaatar, Mongolia
In Ulaanbaatar, the annual average particulate matter concentrations are 14 times higher than WHO's recommended level. The city's poor air quality has caused high incidences of chronic bronchitis and cardiovascular diseases. A thick smog often blankets the city, and at times daytime visibility is so poor that cars must use their headlights.
In Ulaanbaatar, the annual average particulate matter concentrations are 14 times higher than WHO's recommended level. The city's poor air quality has caused high incidences of chronic bronchitis and cardiovascular diseases. A thick smog often blankets the city, and at times daytime visibility is so poor that cars must use their headlights.
6) Cairo, Egypt
The most recent WHO data ranked Cairo as having the second-highest levels of particulates in the world after New Delhi. Another WHO report, issued a few years ago, equated living in the city of 7.8 million to smoking a pack of cigarettes a day. Because Egypt doesn't use unleaded gasoline, citizens are exposed to high levels of lead every day. On occasion, Cairo is also under what's commonly called "the black cloud": a dense, poisonous mass of smoke caused by the seasonal burning of rice by local farmers.
The most recent WHO data ranked Cairo as having the second-highest levels of particulates in the world after New Delhi. Another WHO report, issued a few years ago, equated living in the city of 7.8 million to smoking a pack of cigarettes a day. Because Egypt doesn't use unleaded gasoline, citizens are exposed to high levels of lead every day. On occasion, Cairo is also under what's commonly called "the black cloud": a dense, poisonous mass of smoke caused by the seasonal burning of rice by local farmers.
7) Chongqing, China
One of the fastest-growing cities in China, Chongqing has extremely high levels of air pollution because of coal-burning by power plants and industry. The poor air quality is sickening the city's residents. Studies have found that 4.63% of children under 14 suffer from asthma, although prevalence in girls may be underreported due to cultural bias. Levels of nitrogen oxide are rising because of vehicle emissions.
One of the fastest-growing cities in China, Chongqing has extremely high levels of air pollution because of coal-burning by power plants and industry. The poor air quality is sickening the city's residents. Studies have found that 4.63% of children under 14 suffer from asthma, although prevalence in girls may be underreported due to cultural bias. Levels of nitrogen oxide are rising because of vehicle emissions.
8) Guangzhou, China
Guangzhou, a provincial capital, has a population of roughly 12 million and one of the worst levels of particulates in China. Total suspended particles, according to a 2007 study, were worse than in Beijing. Sulfur dioxide levels, according to the most recent WHO data, were second only to Beijing. As industrial production and traffic within Guangzhou continue to increase, more people are suffering from shortness of breath, coughing, dizziness, weakness and nausea.
Guangzhou, a provincial capital, has a population of roughly 12 million and one of the worst levels of particulates in China. Total suspended particles, according to a 2007 study, were worse than in Beijing. Sulfur dioxide levels, according to the most recent WHO data, were second only to Beijing. As industrial production and traffic within Guangzhou continue to increase, more people are suffering from shortness of breath, coughing, dizziness, weakness and nausea.
9) Hong Kong
Hong Kong features excessive levels of nitrogen dioxide, ozone, sulfur dioxide and carbon monoxide. The Air Pollution Index, which rates the likelihood of people getting ill from breathing a city's air, has recently reached 500, the highest possible level, for multiple parts of Hong Kong. This year saw the worst levels of pollution since 1995, prompting the government to warn people against doing outdoor activities. These levels were 12 to 14 times worse than WHO standards. No wonder a recent Gallup poll has shown that 70% of Hong Kong's population are dissatisfied with their horrible air quality.
Hong Kong features excessive levels of nitrogen dioxide, ozone, sulfur dioxide and carbon monoxide. The Air Pollution Index, which rates the likelihood of people getting ill from breathing a city's air, has recently reached 500, the highest possible level, for multiple parts of Hong Kong. This year saw the worst levels of pollution since 1995, prompting the government to warn people against doing outdoor activities. These levels were 12 to 14 times worse than WHO standards. No wonder a recent Gallup poll has shown that 70% of Hong Kong's population are dissatisfied with their horrible air quality.
10) Kabul, Afghanistan
Because of the war in Afghanistan, the nation's capital has been flooded by refugees from the surrounding countryside. According to an NPR report, Kabul's infrastructure is designed for about 500,000 residents, but it now supports more than 5 million. The overcrowded city is full of wood-burning stoves, and gas-powered generators are commonly used to supply electricity that a war-ravaged grid cannot provide. Cars use leaded gasoline, and residents sometimes burn plastic tires to stay warm. As a result of the increasingly high levels of dangerous particulates in the air, President Hamid Karzai has declared a state of emergency in the capital city. According to the director for the Ministry of Public Health, "Air pollution is a huge problem here, it leads to so many diseases -- respiratory diseases, allergies, miscarriages and even cancer."
Because of the war in Afghanistan, the nation's capital has been flooded by refugees from the surrounding countryside. According to an NPR report, Kabul's infrastructure is designed for about 500,000 residents, but it now supports more than 5 million. The overcrowded city is full of wood-burning stoves, and gas-powered generators are commonly used to supply electricity that a war-ravaged grid cannot provide. Cars use leaded gasoline, and residents sometimes burn plastic tires to stay warm. As a result of the increasingly high levels of dangerous particulates in the air, President Hamid Karzai has declared a state of emergency in the capital city. According to the director for the Ministry of Public Health, "Air pollution is a huge problem here, it leads to so many diseases -- respiratory diseases, allergies, miscarriages and even cancer."
Monday, November 29, 2010
Effective Design to Increase Cycling (ERL)
From the Environmental Research Web
As scientists modeling sustainable urban transport, we are confronted with a significant conundrum. On the one hand, non-motorized transport (NMT) comprises the most sustainable modes. Neither walking nor cycling emits GHG emissions, nor does it contribute to air pollution, nor does it produce noise externalities, nor does congestion result from NMT activities. Hence, we are of course interested in understanding what incentivizes NMT, and how the modal share of cyclists and pedestrians can be increased while satifying mobility demands.
On the other hand, however, the literature on incenvizing factors of NMT and crosselasticities between other modes and NMT is sparse. This is to some degree because investments and political attention go into motorized transport. NMT is mostly handled as a given that will find its place, and does not need further attention. Furthermore, monetary costs of motorized transport make motorized transport an accessible object for transport economists. The intrinsic non-monetary nature of NMT make incentives much harder measurable - a considerable knowledge gap results. As sustainable urban transport gains more attention, pedestrians and cyclists shift into the spotlight.
A recent study of Montreal cycling by Larsen and El-Geneidy helps to shed light on the relationship between bicycle lane availability and attractivity of use. These are some of the main conclusions:
- Recreational cyclists are more likley to use bicycle facilities (e.g. bike lanes)
- Frequent cyclists use lanes less and travel greater distances
- Greater separation of bike lanes from vehicle traffic - e.g. by bicycle alleys - increases trip distance
- Connectivity of the network matters: The longer bicycle lanes are, and the better they are connected with other bicycle lanes and facilities, the more attractive they become for users
The authors conclude by suggesting that physically separated bike lanes are best to encourage novice cyclists. The connectivity of a bicycle network may, however, be the most important design and investment criterion.
It would be very interesting seeing more studies on this topic. What is, for example, the cost-benefit relation of different kind of bicycle facilities (measured in $ infrastructure investment versus marginal increased bicycle use)? How does this cost benefit relation change as a function of bicycle network connectivity? Can these results be generalized to other cities?
Air Pollution in Teheran (Photos from Mehr News Agency)
| Emergency meeting held on Tehran's air pollution | |
|---|---|
| Source: Mehr News Agency, Tehran An emergency committee meeting was held on Sunday to discuss the choking air pollution in the metropolis of Tehran. Tehran's air pollution has reached an alarming level and according to the World Bank statistics, it has incurred around $3.3 billion in financial losses in the current Iranian calendar year (started March 21, 2010). Talking to reporters on the sidelines of the meeting, Tehran Governor Morteza Tamaddon said, "Nothing was approved regarding (declaring) holidays since we believe holidays will not solve any problem." Tamaddon added that 30 ratifications were approved in the meeting which will be discussed in the emergency cabinet session and the results will be announced soon. Health Minister Marzieh Vahid-Dastjerdi also announced on Sunday that there has been a 30% increase in the number of respiratory illness cases during the past few days. |


Sunday, November 28, 2010
Air Pollution Alerts - November 28th, 2010
News & Information; Every Sunday
(Last on November 21st, 2010)
The Daily Green, November 28th, 2010
5 Factors Necessary for Cutting Coal Use in Half.
Times of India, November 28th, 2010
Air pollution death toll on rise in Indian Cities.
Payavand, November 28th, 2010
Emergency meeting held on Tehran's air pollution.
Manila Bulletin, November 28th, 2010
November is Clean Air Month.
CBC News, November 26th, 2010
2nd-hand smoke kills 600,000 a year.
Science Daily, November 25th, 2010
City of Vancouver Sets Transportation Records During 2010 Winter Games.
Xinhua Net, November 25th, 2010
China sets up real-time air quality monitoring network.
Wall Street Journal, November 25th, 2010
Shanghai’s Air Bad, But Crazy Bad?
Environmental Research Web, November 24th, 2010
Insight: observing air pollution sources from space.
Wireless, November 24th, 2010
Mobile communications combat traffic jams and smog in megacities.
Cause-Because, November 24th, 2010
Avoid-shift-improve: The transport sector is in for a spin.
Reuters, November 23rd, 2010
Air pollution exceeds safety limits in big Asian cities.
CNN, November 22nd, 2010
Mayors sign global pact to tackle urban emissions.
CASI, UPenn, November 22nd, 2010
The Road Transport Energy Challenge in India.
Live Mint, November 22nd, 2010
Replacing the traditional ‘chulha’.
Vietnam News, November 22nd, 2010
Kiln pollution continues despite deaths.
Daily Breeze, November 22nd, 2010
Ports agree to updated Clean Air Action Plan.
New York Times, November 21st, 2010
Nations That Limit Coal Use Export It to Feed China’s Need.
Hindustan Times, November 19th, 2010
Delhi tops India's fatal accident list.
DNA India, November 19th, 2010
Maharashtra Pollution Board ignores ‘smoky’ brick kiln.
Xinhua Net, November 17th, 2010
China's coal consumption to top 3.8 bln tonnes in 2015: association.
Shanghai Daily, November 17th, 2010
No worries over air quality after blaze.
Current, November 16th, 2010
Air Pollution: Silent Killer in the City.
Indian Express, November 16th, 2010
Delhi will need 370 km of BRT, more Metro lines.
Xiamen News, November 12th, 2010
Motor vehicles to be labeled with yellow & green signs in Xiamen.
MoNRE, November 10th, 2010
Air pollution high in HCMC, Vietnam.
MoNRE, November 10th, 2010
Lao Cai To Tackle Environment Pollution Hot Spots in Vietnam.
VACNE, November 1st, 2010
Ha Noi to move polluting firms.
Friday, November 26, 2010
TRANSPHORM: Transport related Air Pollution and Health impacts: Integrated Methodologies for Assessing Particulate Matter
A Major Research Project Funded by the European Commission through the Seventh Framework programme
It is known that human activity is a major contributor to air pollution, with influences from emissions, meteorology, climatology and topography modifying the quality of the air that we breathe. It is also known that air pollution can have a major effect on our health. Quantifying health effects of air pollution is difficult because of the complexity of the underlying mechanisms and the variable spatial and temporal distributions exhibited by the different air pollutant species. For effective pollution abatement measures to counter, or at least limit, the effects of air pollution on health, an accurate cause and effect relationship must be established between the pollution profile and the associated health impact. The interactions between the emission, meteorological conditions and physical and chemical transformation processes occurring in the atmosphere, mean that sophisticated computer models are needed to produce reliable predictions of air quality to support policy formulation.
TRANSPHORM is a pan European project involving 21 multidisciplinary organisations, specialising in air pollution, meteorology, climate and health from 14 different countries across Europe. The project aims to develop and implement an integrated methodology to assess the health impacts of particulate matter (PM) resulting from transport related air pollution covering the whole chain from emissions to disease burden. An important element of TRANSPHORM is its multidisciplinary approach to tackle the research challenges by bringing together physicists, chemists, meteorologists, health experts, computer modellers as well as users.
TRANSPHORM focuses on the impacts of particulate matter (PM) which pose a particular risk to health. A number of research avenues will be followed in the project with emphasis on particulate matter emissions from all types of transport modes, measurements of the concentrations and composition in European cities, modelling concentrations on city and European scales, estimation of exposure, quantification of the relationship with health outcomes, and the development of a novel integrated tool for researchers and users to assess the health impacts. In addition to incorporating state of the art models, the integrated assessment tool will offer flexibility by including a variety of modelling modules based on their complexity and application.
If you wish to know more about this project, and related issues,please register free on the website
@ http://www.transphorm.eu/
Crazy Bad Air in Beijing?
A concerned resident of Beijing and fellow member of the sim-air list, Vance Wagner, compared the air quality monitoring data from US Embassy and Official stations in Beijing, for days preceding and following the "crazy bad" air days (reported in NPR and other media outlets) and here is what he has to say..
Link to the post
http://www.livefrombeijing.com/2010/11/crazy-bad-air-quality-in-beijing/
******
Link to the post
http://www.livefrombeijing.com/2010/11/crazy-bad-air-quality-in-beijing/
******
A few days ago, the US embassy’s BeijingAir Twitter feed, which automatically reports Beijing’s hourly air quality, made headlines across the web by announcing that the air quality was “crazy bad.” Although the wording was quickly revised to the more politically-palatable “beyond index,” the impact was immediate. “Crazy bad” air was all the buzz of the blogosphere and at social events over the weekend; I have a feeling “crazy bad” would make it onto Beijing’s Word of the Year list, if there were such a thing. MyHealthBeijing’s Dr. Richard St. Cyr even suggested “Crazy Bad” T-shirts.
In this post, I’ll look a little closer at the data behind the Crazy Bad incident to see what we can learn. The graph below shows hourly and daily data from the BeijingAir Twitter feed along with official air quality data from the Ministry of Environmental Protection (available here, Chinese only). For clarity, I show all data in terms of particulate matter concentration, not standardized index. (I’ve converted MEP’s reported API numbers to PM concentration; for background on the difference and methodology, see this post.) Note that MEP’s data is reported for a 24-hour period from noon to noon, which is why the daily data changes at noon each day. The break in the red corresponds to the BeijingAir Twitter feed not reporting any data for a couple of days after the Crazy Bad incident.

This graph reveals some really fascinating info:
1) The Crazy Bad spike on Thursday and Friday last week was both preceded and followed by gorgeous, wonderfully clean weekend days. On 11/15, the air quality was, by all accounts, “good.” By 11/18, though, the air pollution had steadily risen to what the US calls “hazardous“/”crazy bad,” and China calls “heavily polluted” (”重污染”). After the steep rise, the air quality improved just as dramatically; MEP’s reported PM10 numbers dropped 297 points – from 334 to 37 – from 11/21 to 11/22 alone. This demonstrates just how quickly the air quality can change in Beijing – both for better and for worse.
Why did it change so quickly? The start of the heating season on 11/15? Possibly, although that wouldn’t explain the sudden drop beginning 11/20. To be honest, the answer is probably less dramatic: weather. Most day-to-day pollution changes in Beijing are caused by changes in temperature and wind patterns. If there are a few days of static air, or light winds blowing from the southeast and trapping pollution against the mountains to the north and the west, the pollution builds up very quickly. I should find the time to post separately about this.
2) MEP’s air quality data tracked the embassy’s with reasonable consistency. This is actually encouraging; we should be grateful at least for some degree of accuracy and transparency with official data. There are some differences, but we shouldn’t expect them to track exactly. This is because the MEP data is an average of multiple sites across the city, while the embassy data is just a single point. Plus, they are measuring slightly different things.
In the past, we have seen situations where rapid and very short-term pollution spikes highlighted by the BeijingAir hourly readings were not reflected in daily MEP averages, but that doesn’t appear to have happened here.
(As I point this out, though, I should also note that I do not intend to make excuses for or to justify China’s current reporting mechanism. For the record, I would like to see at least three immediate changes to China’s air quality reporting: hourly release of data, more representative descriptions of health impacts, and some sort of real-time alert system for at-risk populations to avoid exposure.)
Lastly, a few data highlights for the numbers geeks out there (background on international standards here):
US EPA daily ambient air quality standard for PM2.5: 35 ug/m^3
Peak PM2.5 concentration reported by BeijingAir, 11/19: 557 ug/m^3
WHO recommended daily limit for PM10 exposure: 50 ug/m^3
China daily ambient air quality standard for PM10: 150 ug/m^3
Peak PM10 concentration reported by MEP, 11/19: 430 ug/m^3
Wednesday, November 24, 2010
Is LPG Bad for the Air Quality in Indian Cities?

Hindustan Times on September 20th, 2010, released a similar note, questioning the results, which are not in the public domain, but being presented at international scientific conferences. The article reports
An IOC presentation at a seminar organised by diesel vehicle manufacturers said that half of PM 2.5 in residential areas of Delhi was because of combustion of domestic LPG. In industrial areas, it was as high as 61 per cent and at traffic junctions 40.5 per cent.
Is this even logically possible?
- How can a clean burning LPG contribute to ~40% of the air pollution being observed in the city?
- What is the fraction of LPG usage in Delhi compared to petrol or diesel or CNG to give 40-60 percent contributions to PM2.5, the most harmful of the pollutants?
Is LPG not a clean fuel anymore?
Similar results were presented for Mumbai at the Better Air Quality Conference in Singapore in November, 2010, by NEERI - nearly 13 to 34 percent of PM2.5 pollution in Mumbai is due to LPG combustion?
Link to the presentation by NEERI.
How can once a clean fuel and most used domestic fuel be that deadly?
What is the science behind these numbers?
The CPCB study, which Environment Minister Jairam Ramesh has decided not to put in public domain, is likely to be the basis for India’s future auto fuel policy.

If these results are good enough to be presented at international conferences, why is this report not public?
Similarly, this is the kind of false interpretation of the results, which leads to think that we can put a vacuum cleaner in the air and suck up all the bad parts of the air and make it all better for us to breath.
What is source apportionment?
A number of source apportionment studies are conducted across the globe and a number of them are on-going. Technically, this is the most sound approach to pinpoint the contributions of various sources to the local air pollution. However, the methodology does have some limitations which can be rectified with proper planning and local resource information.

In short, this methodology starts with the sampling of pollution (what we breathe and what we monitor) on to a filter, followed by chemical analysis of the sample to identify the mass of various metals, ions, and carbon compounds. The individually masses are then statistically matched with source profiles (also sampled and analyzed similar to the air samples, but sampled as close to the source as possible). The last part is called Receptor Modeling; the end result of which is the apportionment of sources for the air sample monitoring.
Of course, the source profiles are wrongly selected or erroneous during their establishment, the results will be illogical or hard to support the real world observations (like above).
See
- Review of the methodologies and source apportionment works from Latin America, Africa, and Asia
- Review of the source apportionment works to evaluate the role of transport in Chinese cities
Winter Stove Workshop - January, 2011
Winter Stove Workshop - January 22-26, 2011
Aprovecho Research Center is pleased to announce our 2011 Winter Stove Workshop. The five-day workshop is designed to provide agency personnel, policy experts, funders, future field technicians, and others interested in clean cookstoves an intensive course in the principles of stove design, testing, and use.
The workshop, more affectionately known as “Stove Camp,” takes place at the Aprovecho Research Center in Cottage Grove, Oregon (two hours south of Portland). Participants are encouraged to continue your learning by attending the international Engineers in Technical and Humanitarian Opportunities of Service (ETHOS) conference, held in Seattle that Friday, Saturday, Sunday.
In five days participants will learn:
“Stove Camp” (as featured in The New Yorker magazine) is a hands-on laboratory, and our teaching methodology is experiential. As a participant, you will work with Aprovecho experts and other participants to build four types of stoves, and then test your work. You don’t need shop skills to complete this workshop. Space is limited to 30 participants, so we encourage you to reserve a spot soon. Cost: $800 includes most meals.
Contact Aprovecho Office Manager Mike Hatfield at: apromike@gmail.com
Aprovecho Research Center is pleased to announce our 2011 Winter Stove Workshop. The five-day workshop is designed to provide agency personnel, policy experts, funders, future field technicians, and others interested in clean cookstoves an intensive course in the principles of stove design, testing, and use.
The workshop, more affectionately known as “Stove Camp,” takes place at the Aprovecho Research Center in Cottage Grove, Oregon (two hours south of Portland). Participants are encouraged to continue your learning by attending the international Engineers in Technical and Humanitarian Opportunities of Service (ETHOS) conference, held in Seattle that Friday, Saturday, Sunday.
In five days participants will learn:
- Design principles for a variety of rocket, fan, charcoal and TLUD stoves
- How to improve combustion efficiency
- Heat transfer basics for getting more energy from the fire to the pot
- Testing protocols for evaluating, comparing and improving stove designs using both laboratory and infield equipment
- How to construct inexpensive ‘90% emission reduction’ cook stoves
“Stove Camp” (as featured in The New Yorker magazine) is a hands-on laboratory, and our teaching methodology is experiential. As a participant, you will work with Aprovecho experts and other participants to build four types of stoves, and then test your work. You don’t need shop skills to complete this workshop. Space is limited to 30 participants, so we encourage you to reserve a spot soon. Cost: $800 includes most meals.
Contact Aprovecho Office Manager Mike Hatfield at: apromike@gmail.com
Subscribe to:
Posts (Atom)