Thursday, October 13, 2016

Night Time Temperatures are Dropping Over the Indo-Gangetic Plain

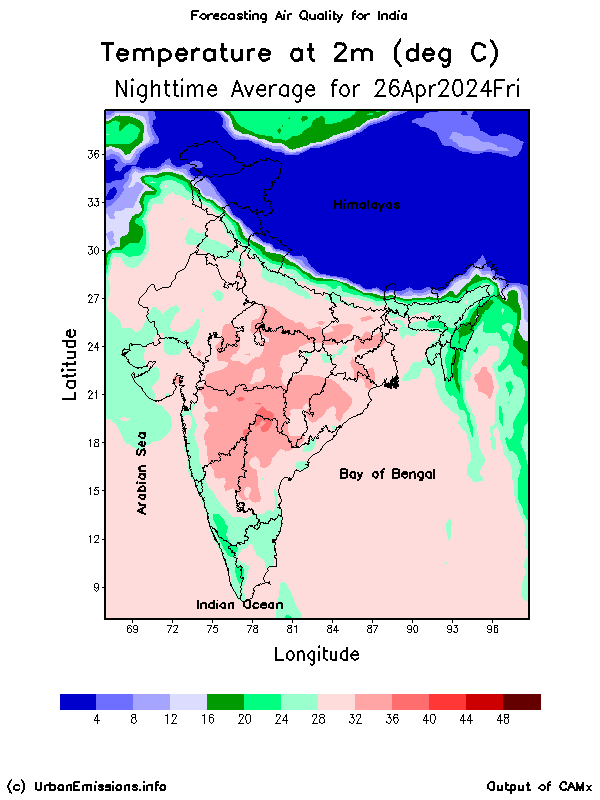
We know how bad the winter time air pollution can be in these parts, especially due to the need for space heating (indoors and outdoors), for which biomass and waste burning is equally responsible. Here is a snapshot of average night temperatures forecast on October 11th, 2016 - is this the start of the heating season?


Forecasts are updated every day @ 6 PM, Indian Standard Time @ http://www.indiaairquality.info

Winter Worsens Delhi's Pollution Levels

Blame games are beginning to creep up in the media, with no real action for the past one year.

See the article @ Mail Today
See the article @ Financial Express
See the article @ India Live Today

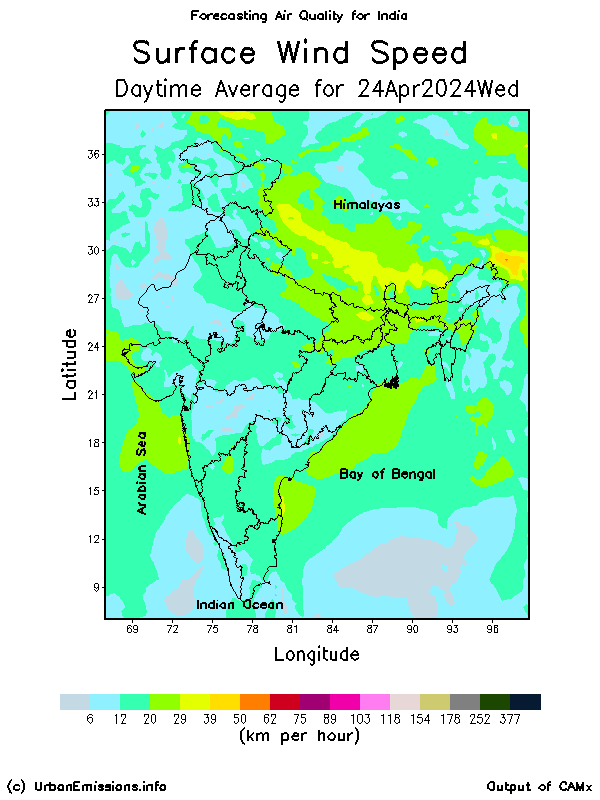
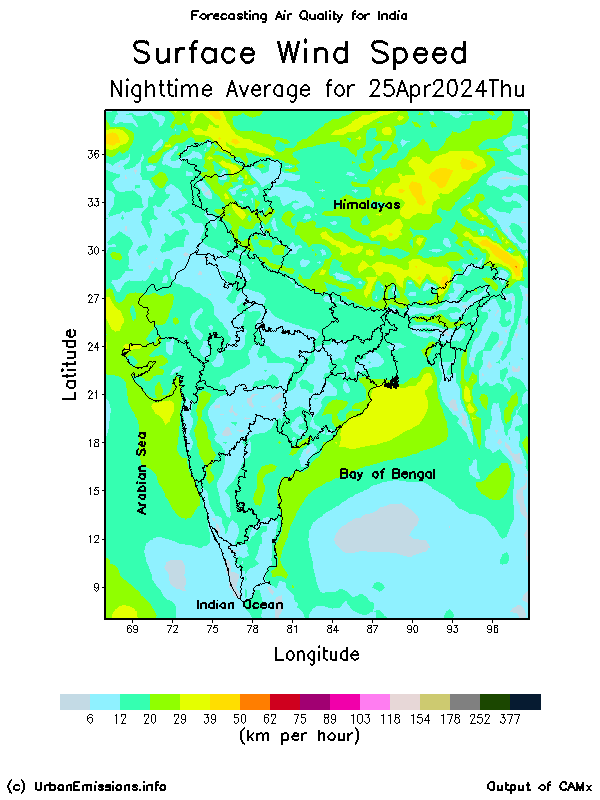
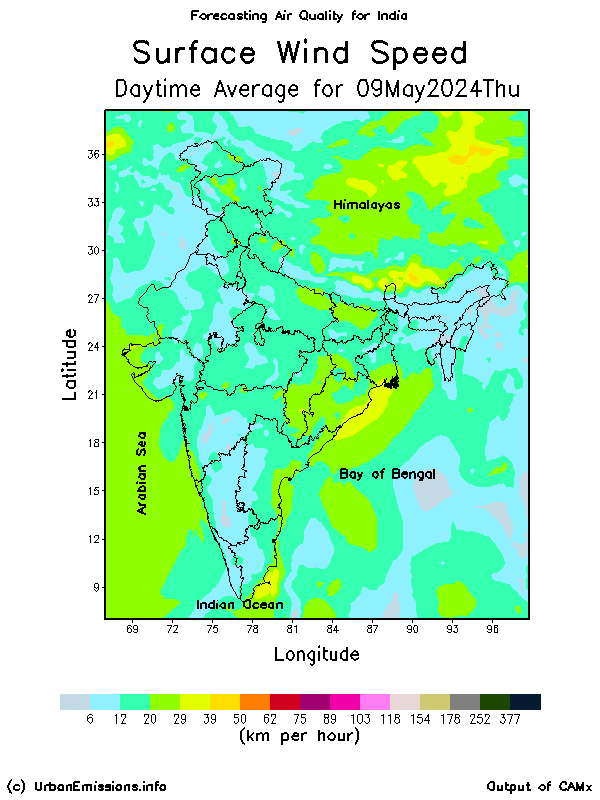
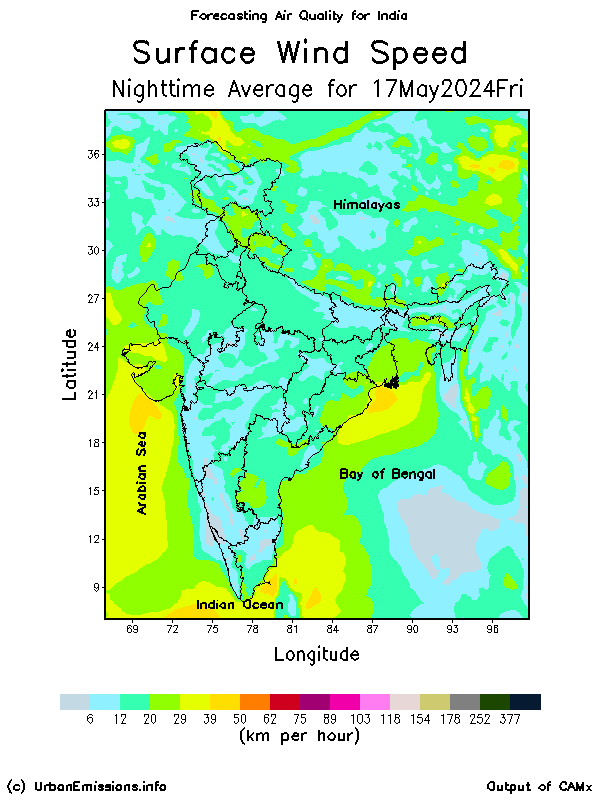
Wind are slowing down - see nighttime and daytime forecasts for the next three days.
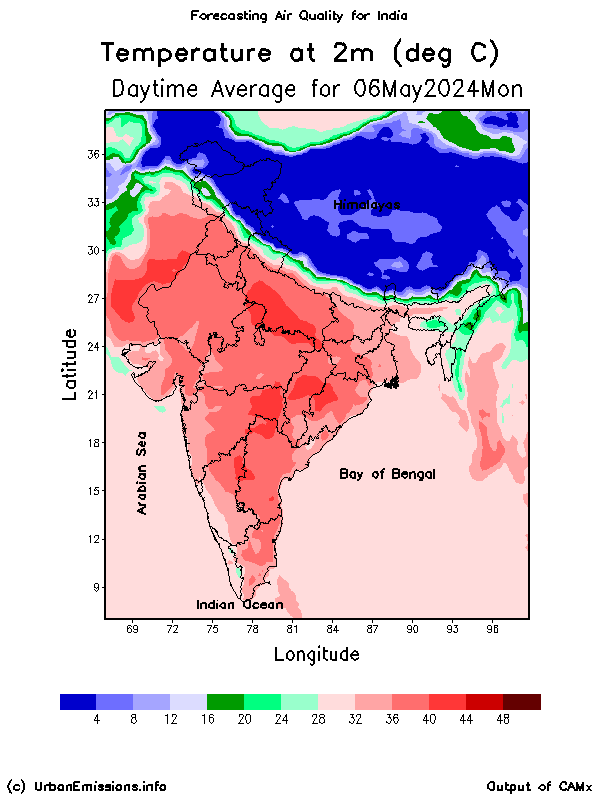
Temperature are dropping, triggering the need for space heating - see nighttime and daytime forecasts for the next three days.

This is modeled source contributions to the ambient particulate pollution (PM2.5) in South Delhi district (one of the 14 districts in the National Capital Region (NCR) of Delhi). The calculations are conducted in forecast mode. More NCR district reports @ Delhi Air Quality.Info


  • DUST.ERO = wind blown dust from the dry and arid regions, dependent of hourly meteorological conditions
  • OPEN.FIRES = open biomass burning (both agricultural lands and forest areas), a seasonal affair linked to dry conditions and agricultural clearing patterns
  • TRANS.PASS = contribution of passenger vehicles (2Ws, 3Ws, 4Ws, Taxis, and Buses)
  • TRANS.FRGT = contribution of freight vehicles (heavy and light trucks, and non-road vehicles)
  • RD.DUST = contribution of re-suspended dust on the roads due to vehicle movement and construction activities
  • PP.DGS = contribution of power plants and in-situ diesel generator sets
  • INDUS = contribution of industrial activities
  • HOUS.HLD = contribution of domestic cooking, space heating, water heating, and lighting
  • WST.BURN = contribution of open waste burning
  • OTHERS = contribution of aviation, shipping, biogenics, etc..
A number of source apportionment studies were conducted in Delhi (more in Delhi than in any of the other Indian cities). We summarized the known particulate pollution source apportionment studies, as an open article, "what's polluting Delhi's air".
See what is happening at the regional scale, which is conducted as part of the all India air pollution forecasting program, hosted @ http://www.indiaairquality.info. The animation below is from a WRF-CAMx simulation conducted @ 0.25x0.25 degree resolution (approximately, 25km x 25km).

Construction Sites Are Never Covered with Tarpaulin


Chandan Singh, from Hermu in Jharkhand, works at a construction site on Golf Course road. He handles cement with his bare hands and says he finds it hard to breath due to the dust. “All my life I have worked at construction sites. As these sites are spreading, it is sometimes difficult to sleep and people here cough for months,” he says. In the absence of measures to control pollution from construction sites, thousands of labourers like Chandan have to survive in hazardous conditions every day.

According to the Ministry of Environment & Forests (MoEF) guidelines, civic authorities should take measures to ensure toxins from construction machinery and vehicles, and construction dust are not released in the air. Similarly, the Haryana State Pollution Control Board (HSPCB) ordered that for construction activity beyond 2 lakh sqft, clearance has to be taken from the government on 70 environmental safety parameters notified by MoEF.

As per construction norms, sites should be covered with a tarpaulin sheet to prevent spread of dust. But on ground, these norms are nowhere to be seen. “Only by implementing norms can the pollution levels be reduced. Though several factors are responsible for air pollution, dust from construction sites in the region is a major contributor,” said Anumita Roychowdhury, executive director (research and advocacy), CSE.

Read the full article @ Hindustan Times

Early Smog in Delhi

Hold your breath and read the full article @ Mail Today

Wednesday, October 12, 2016

Open Fires in Northern India Creeping to Impact Air Quality

Check the calculated emissions from the FINN global inventory based on fire counts - a concentrated number of hot spots are now detectable over Punjab and Haryana and these emissions are dispersing far enough to detect their signature in Delhi. Below is our modeled source apportionment for South Delhi district from October 11th, 2016.

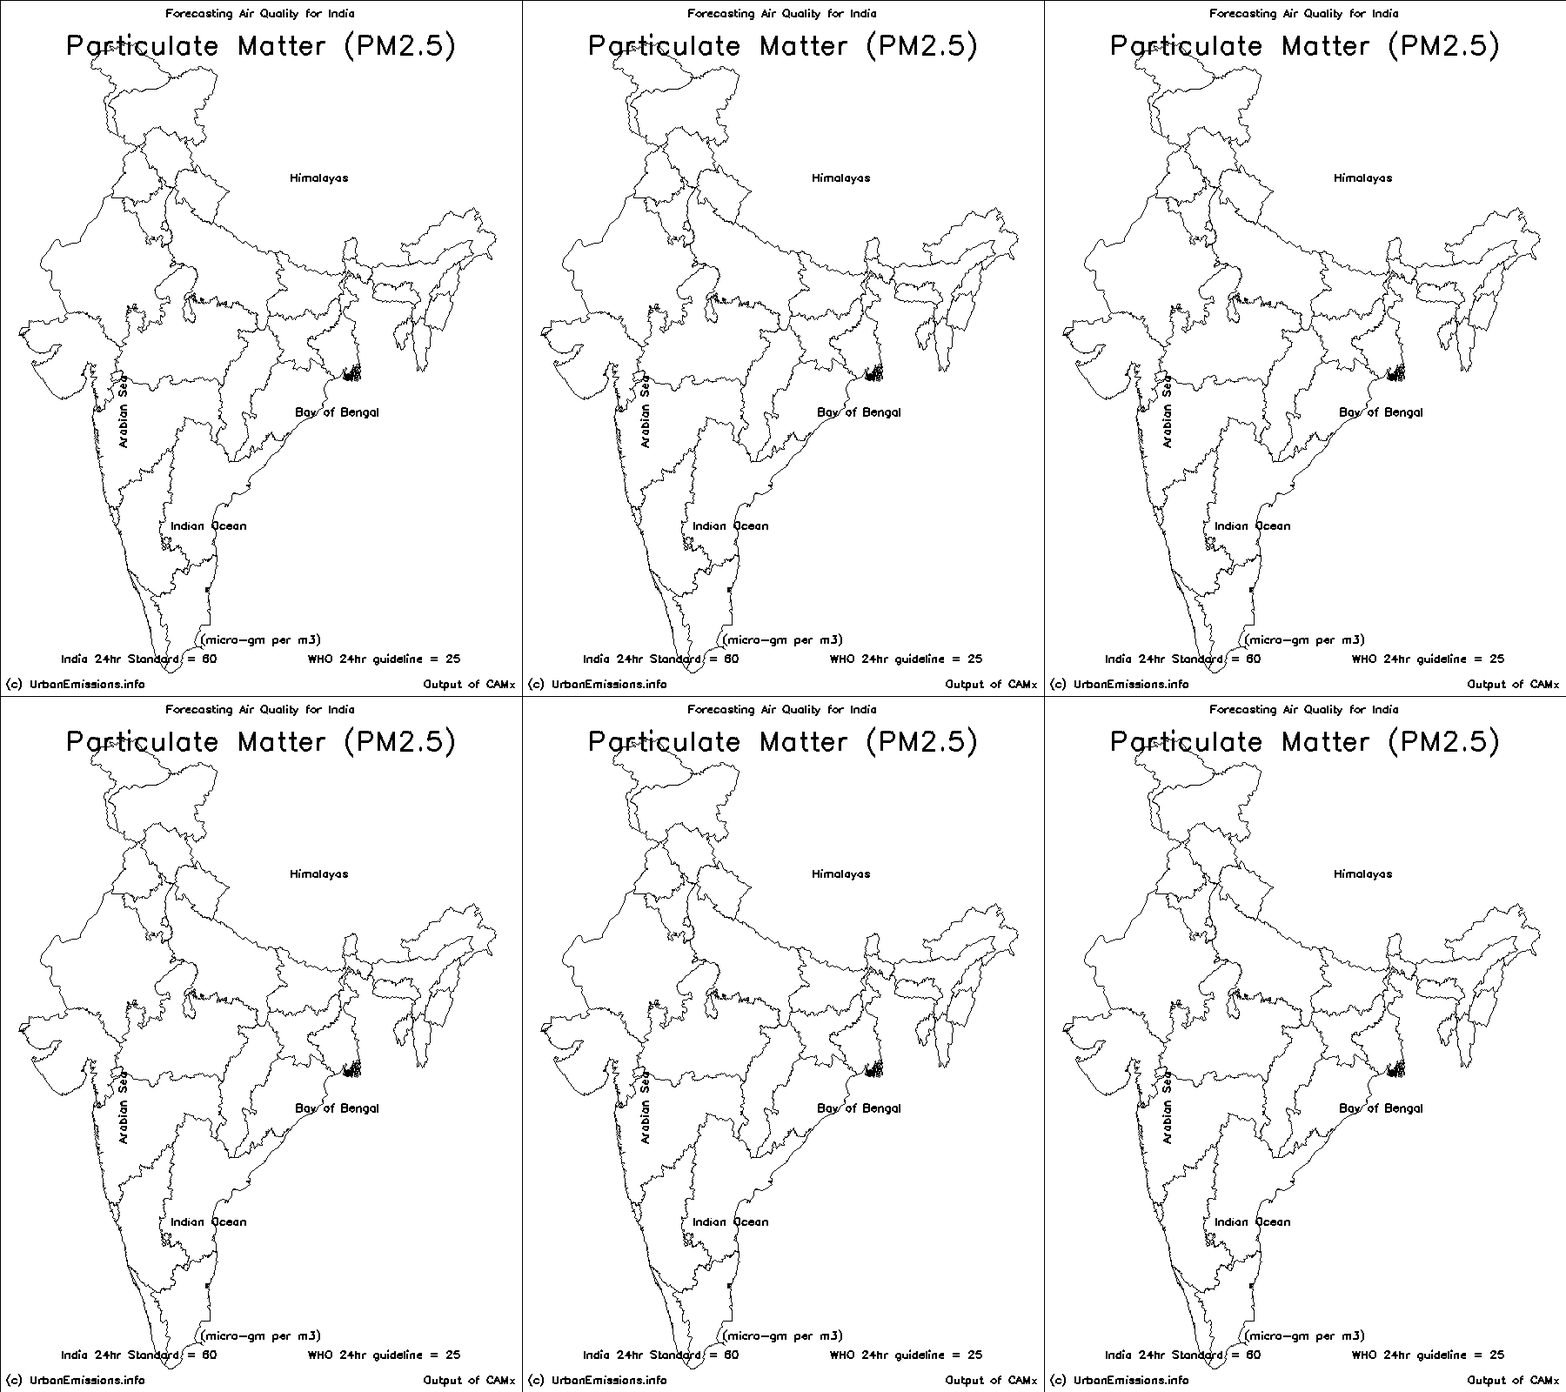
Modeled PM2.5 concentrations from October 11th, 2016 for the next three days (including all the emission sources). For more current updates from our forecasting program, please visit


Friday, October 07, 2016

Clean Air, but Ozone is Peaking in Beijing

Blue skies and white clouds are no longer a rare sight in my home city of Beijing. Public anger over China’s toxic smog has pushed the central and city governments to tackle high levels of deadly PM2.5 particulates that can contribute to heart and lung disease. A new report from Clean Air Asia shows the crackdown is working; it found an average drop of 14.1% in PM2.5 levels across 74 cities in 2015.

But blue skies do not necessarily equate to clean air. Ozone levels have risen significantly, especially in major cities, according to a report published in September by the Clean Air Alliance of China (CAAC). The 2016 China Air Quality Management Assessment shows ozone levels have bucked the general downward trend in pollution levels, and risen significantly in some cities.

Ozone levels in Beijing rose a staggering 26.6% in a year. In Jiangsu province, home to vast swathes of Shanghai’s industrial hinterland, they rose 8.4%. These problems areas are China’s most developed areas. Beijing has a higher level of car ownership than anywhere else in China. And Beijing’s average duration of congestion per day rose to three hours in 2015, up from one hour and fifty-five minutes in 2014. More gridlock means more exhaust emissions. In Jiangsu and Shanghai, air quality suffers from the combination of high levels of car ownership and large industrial sectors.

Read the full article @ China Dialogue

Thursday, October 06, 2016

Peaking Air Pollution Levels in Hanoi

Hanoi’s air pollution was recorded as the second worst in the world Wednesday morning by a global air quality watchdog. The Real-time Air Quality Index, which compiles information from local authorities globally, ranked the city as “very unhealthy” based on data provided by the U.S. Embassy’s monitoring station. Only India’s Varanasi ranked higher on the index. Hanoi’s air pollution is frequently blamed on traffic congestion. It is reported to be home to 5.5 million vehicles with 700 motorbikes for each kilometer/mile of road.


A recent study from the environment ministry put Hanoi’s nitrogen dioxide levels at 1.3 times permitted levels and particulate matters, which are defined as airborne particles of less than 10 micrometers in length, at 1.4 times the limit. High levels of smog in recent years have also made face masks a common site in the city, with carbon filter masks particularly popular. Duc Nguyen, a 20-year-old Vietnamese photographer living in Hanoi, told Anadolu Agency on Wednesday that air pollution is a big concern for him. “It was bad a couple of months before but its even worse now,” he said, adding that he blames the pollution on recurring health aliments. “I feel sleepy, breathless and my muscles are tired all the time.”

Read the full article @ World Bulletin

Effect of Air Pollution on Office Workers Performance

For anyone who has tried jogging through smog, the physically sapping impacts of air pollution should come as no surprise. But pollution doesn’t just slow down runners, it hampers workers too. Research by Tom Chang of the University of Southern California and colleagues found that pear packers working indoors were slowed by air pollution even at levels well below current air-quality standards. Might sedentary office workers indoors, also be slowed down by poor air quality?

In a second paper, Mr Chang and his colleagues studied China, where air pollution is a major problem. China releases a daily air-pollution index (API)—also referred to as an air-quality index—which rates air quality based on the health risk it represents. Anything above 100 is bad news. In Shanghai the index periodically hits 150, putting everyone’s health at risk. To establish the correlation between productivity and air pollution, the authors focus on office workers in two call centres in Shanghai and Nantong, where productivity can be measured by counting the number of calls workers handle per day.

What they find isn’t good. On days with higher air pollution, workers spend more time on breaks and complete fewer calls. On average, a 10% increase in the API was associated with a 0.35% decrease in number of calls handled per day. That quickly adds up: workers in the call centres studied are estimated to be 6% more productive on low-pollution days than on days when pollution is high. The likely culprit for office workers is particulate matter, which can easily enter buildings through windows and vents. The smallest of these particles enter the blood stream and the central nervous system, affecting concentration and mental performance.

Read the full article @ The Economist

Tuesday, October 04, 2016

How Poorer Countries Suffer More than the Rest


On Sunday, India ratified its accession to the Paris climate accords on the 147th anniversary of the birth of Mahatma Gandhi. President Obama congratulated India in a tweet, saying that "Gandhiji believed in a world worthy of our children. In joining the Paris Agreement, @narendramodi & the Indian people carry on that legacy," using a Hindi honorific for the man who championed Indian self-rule and stewardship of its land. The Paris agreement is the international community's biggest push yet to limit carbon emissions and other forms of pollution. Unfortunately, if worthiness is measured by being able to live in a world where the air one breathes does not spread disease and blacken one's lungs, then we are far from it.

A World Health Organization report last week said that 92 percent of people worldwide breathe unhealthy air and that about 3 million deaths a year — mostly from cardiovascular, pulmonary and other noncommunicable diseases — stemmed from high levels of air pollution. The number of people at risk rises to 98 percent in urban areas of low- and middle-income countries. Nearly 2 million of the deaths brought on early by pollution are in Southeast Asia and the Western Pacific region, according to the report, compared with 333,000 in Europe and the Americas. Read the full report @ Washington Post

Delhi Trying to Stop Stubble Burning

The Central Pollution Control board (CPCB) on Sunday convened a meeting of all member secretaries to devise an action plan to “effectively” and “strictly” monitor any incidence of burning of crop stubble in Haryana, Uttar Pradesh and Punjab. The phenomenon, which impacts the whole of north India can be substantially reduced, if not stopped, only if states coordinate better with each other, say experts. “This phenomenon begins to appear from around the second week of October. Despite a ban on burning wheat and paddy residue, farmers have been found flouting the norm. The respective authorities even send notices but to no avail. Hence, every state has been asked to heighten its vigil,” said an official who was present at the CPCB meeting. Read the full article @ Hindustan Times

Also see, what's polluting Delhi's air?

Sunday, October 02, 2016

Kolkata Ranked 4th Worst Polluted City

Coarse dust particles - a byproduct of construction activities - have made Kolkata the fourth most polluted ‘megacity’ in the world, a recent report published by the World Health Organization (WHO) claims. While the report has placed Delhi at the top of the list, Cairo and Dhaka occupy the second and third positions respectively. Kolkata comes fourth just ahead of Mumbai. Read more @ Hindustan Times and track pollution in your city with this real-time air quality map

According to the report the PM10 level in Kolkata during this pseriod was nearly seven times the limit prescribed by WHO. If one considers the Indian safety limits, which is less stringent, Kolkata’s PM10 pollution level is more than double. These particles can cause asthma attacks, aggravate bronchitis and other lung diseases, and reduce the body’s ability to fight infections, said doctors. The report is based on the presence of such particles in the air of the city between 2011 and 2015. This list was prepared solely on the basis of PM10 level, and other pollutants such as PM2.5, NOx, SOx, CO2 etc were not included. If all Indian cities are taken into account the Gwallior reported the highest pollution. (But it is not a megacity.)

While the city’s PM10 level soared to around 140 micrograms per cubic metre, the WHO’s safety limit for this coarse pollutants is not more than 20 micrograms per cubic metre. The Indian safety limit is 60 micrograms per cubic metre. Delhi which has been ranked as the most polluted megacity has PM10 level as high as 240 micrograms per cubic metre. Mumbai which ranks fifth has PM10 level around 120 micrograms per cubic metre. The WHO report also suggests that the PM10 level in Kolkata was just around 100 micrograms per cubic metre in 2009-2010. So what forced the level of dust particles to shoot up?

Chatterjee added that another source of PM10 in Kolkata is the westerly winds that come in from the west and north India during the winter. They bring the dust particles from neighbouring and far flung states including Delhi, UP, Bihar and Jharkhand, raising pollution levels during winter months. Though physicians and scientists claimed that it is the PM2.5 – the finer particulate matter measuring less than 2.5 micros – which are more deadly, they also pointed out PM10 is also bad enough to cause damage and trigger a variety of pulmonary diseases as they can can penetrate deep into the lungs.

**************

This is modeled air quality for India in forecast mode. The reports for all the 640 Indian districts everyday @ India Air Quality.Info


See what is happening at the regional scale, which is conducted as part of the all India air pollution forecasting program, hosted @ http://www.indiaairquality.info. The animation below is from a WRF-CAMx simulation conducted @ 0.25x0.25 degree resolution (approximately, 25km x 25km).