Air pollution is a growing problem in most cities (big and small). The "Daily Dose" aims to disseminate the best available information on air pollution and engage in discussions to better understand the process of air quality management. For more details visit https://www.urbanemissions.info
Tuesday, December 31, 2024
Op-Ed - Why the world needs lazier robots
Direct Article Link or click on the image below.

Monday, December 30, 2024
Op-Ed - 77 Facts That Blew Our Minds in 2024
Direct Article Link or click on the image below.

Video - Perceptions of Environmental Justice
Op-Ed - Solar and battery storage to make up 81% of new U.S. electric-generating capacity in 2024
Direct Article Link or click on the image below.

Op-Ed - United States produces more crude oil than any country, ever
Direct Article Link or click on the image below.

Humor in Pollution - Some Revisions to the World Atlas by Climate Change this Year
Direct Article Link or click on the image below.

Op-Ed - What has four stomachs and could change the world?
Direct Article Link or click on the image below.

Friday, December 27, 2024
Op-Ed - The Developing World Is Buying $180,000 E-buses on the Cheap
Direct Article Link or click on the image below.

Op-Ed - Sport produces mountains of high-tech waste
Direct Article Link or click on the image below.

Op-Ed - Why your new phone should be a used one
Direct Article Link or click on the image below.

Op-Ed - The New Climate Gold Rush: Scrubbing Carbon From the Sky
Direct Article Link or click on the image below.

Op-Ed - Your gadgets are actually carbon sinks — for now
Direct Article Link or click on the image below.

Monday, December 23, 2024
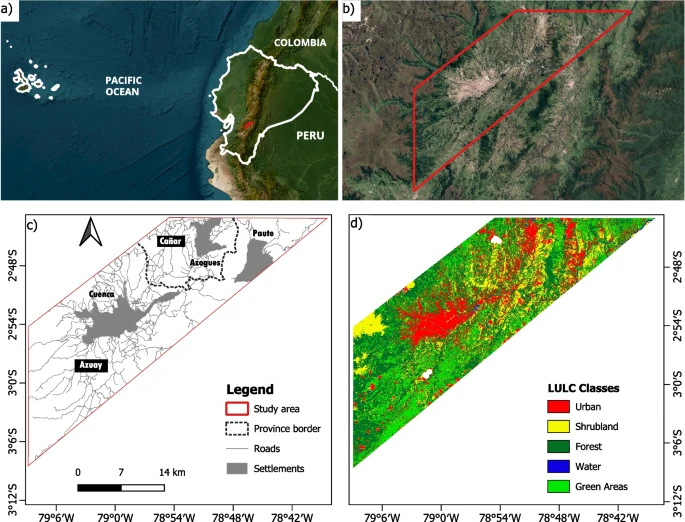
Journal Article - How does air quality reflect the land cover changes: remote sensing approach using Sentinel data
Direct Article Link or click on the image below.
Op-Ed - Shifts in Shopping: Transforming Malls Into Parks
Direct Article Link or click on the image below.

Op-Ed - Gas Could Mean Billions for Indigenous People in Canada. Some Fear a Cost
Direct Article Link or click on the image below.

Op-Ed - CO2 emissions from new North Sea drilling sites would match 30 years’ worth from UK households
Direct Article Link or click on the image below.

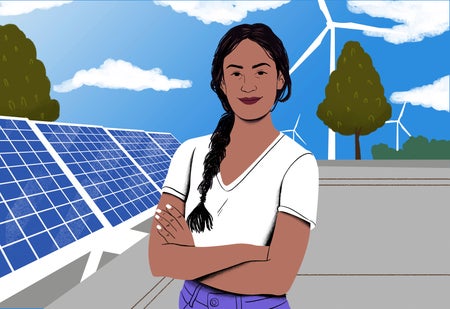
Op-Ed - How Feminism Can Guide Climate Change Action
Direct Article Link or click on the image below.
Op-Ed - A study of 11,000 twins shows how to make America walkable again
Direct Article Link or click on the image below.

Saturday, December 21, 2024
Journal Article - Modeling the Global Impact of Chlorine Chemistry on Secondary Organic Aerosols
Direct Article Link or click on the image below.

Journal Article - Saharan dust linked to European hail events
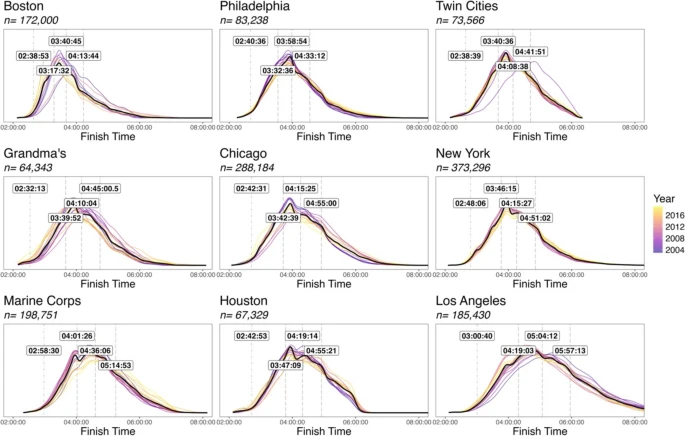
Journal Article - Running on Fumes: An Analysis of Fine Particulate Matter’s Impact on Finish Times in Nine Major US Marathons, 2003–2019
Direct Article Link or click on the image below.
Op-Ed - India to surpass China as the top source of global oil consumption growth in 2024 and 2025
Direct Article Link or click on the image below.

Op-Ed - Carbon emissions from tourism are rising disproportionately fast
Direct Article Link or click on the image below.

Op-Ed - Spending Christmas with ‘Dr. Doom’
Direct Article Link or click on the image below.

Resource Material - Planetizen’s Top Urban Planning Books of 2024
Direct Article Link or click on the image below.

Op-Ed - Over 5,600 wood burning complaints led to just four fines
Direct Article Link or click on the image below.

Op-Ed - Cambodia urged to rethink its costly LNG ambitions
Direct Article Link or click on the image below.

Video - The role of biomass in production of cement, and iron and steel
Friday, December 20, 2024
Book - Air Quality - Science, Impacts, and Management
Direct Article Link or click on the image below.

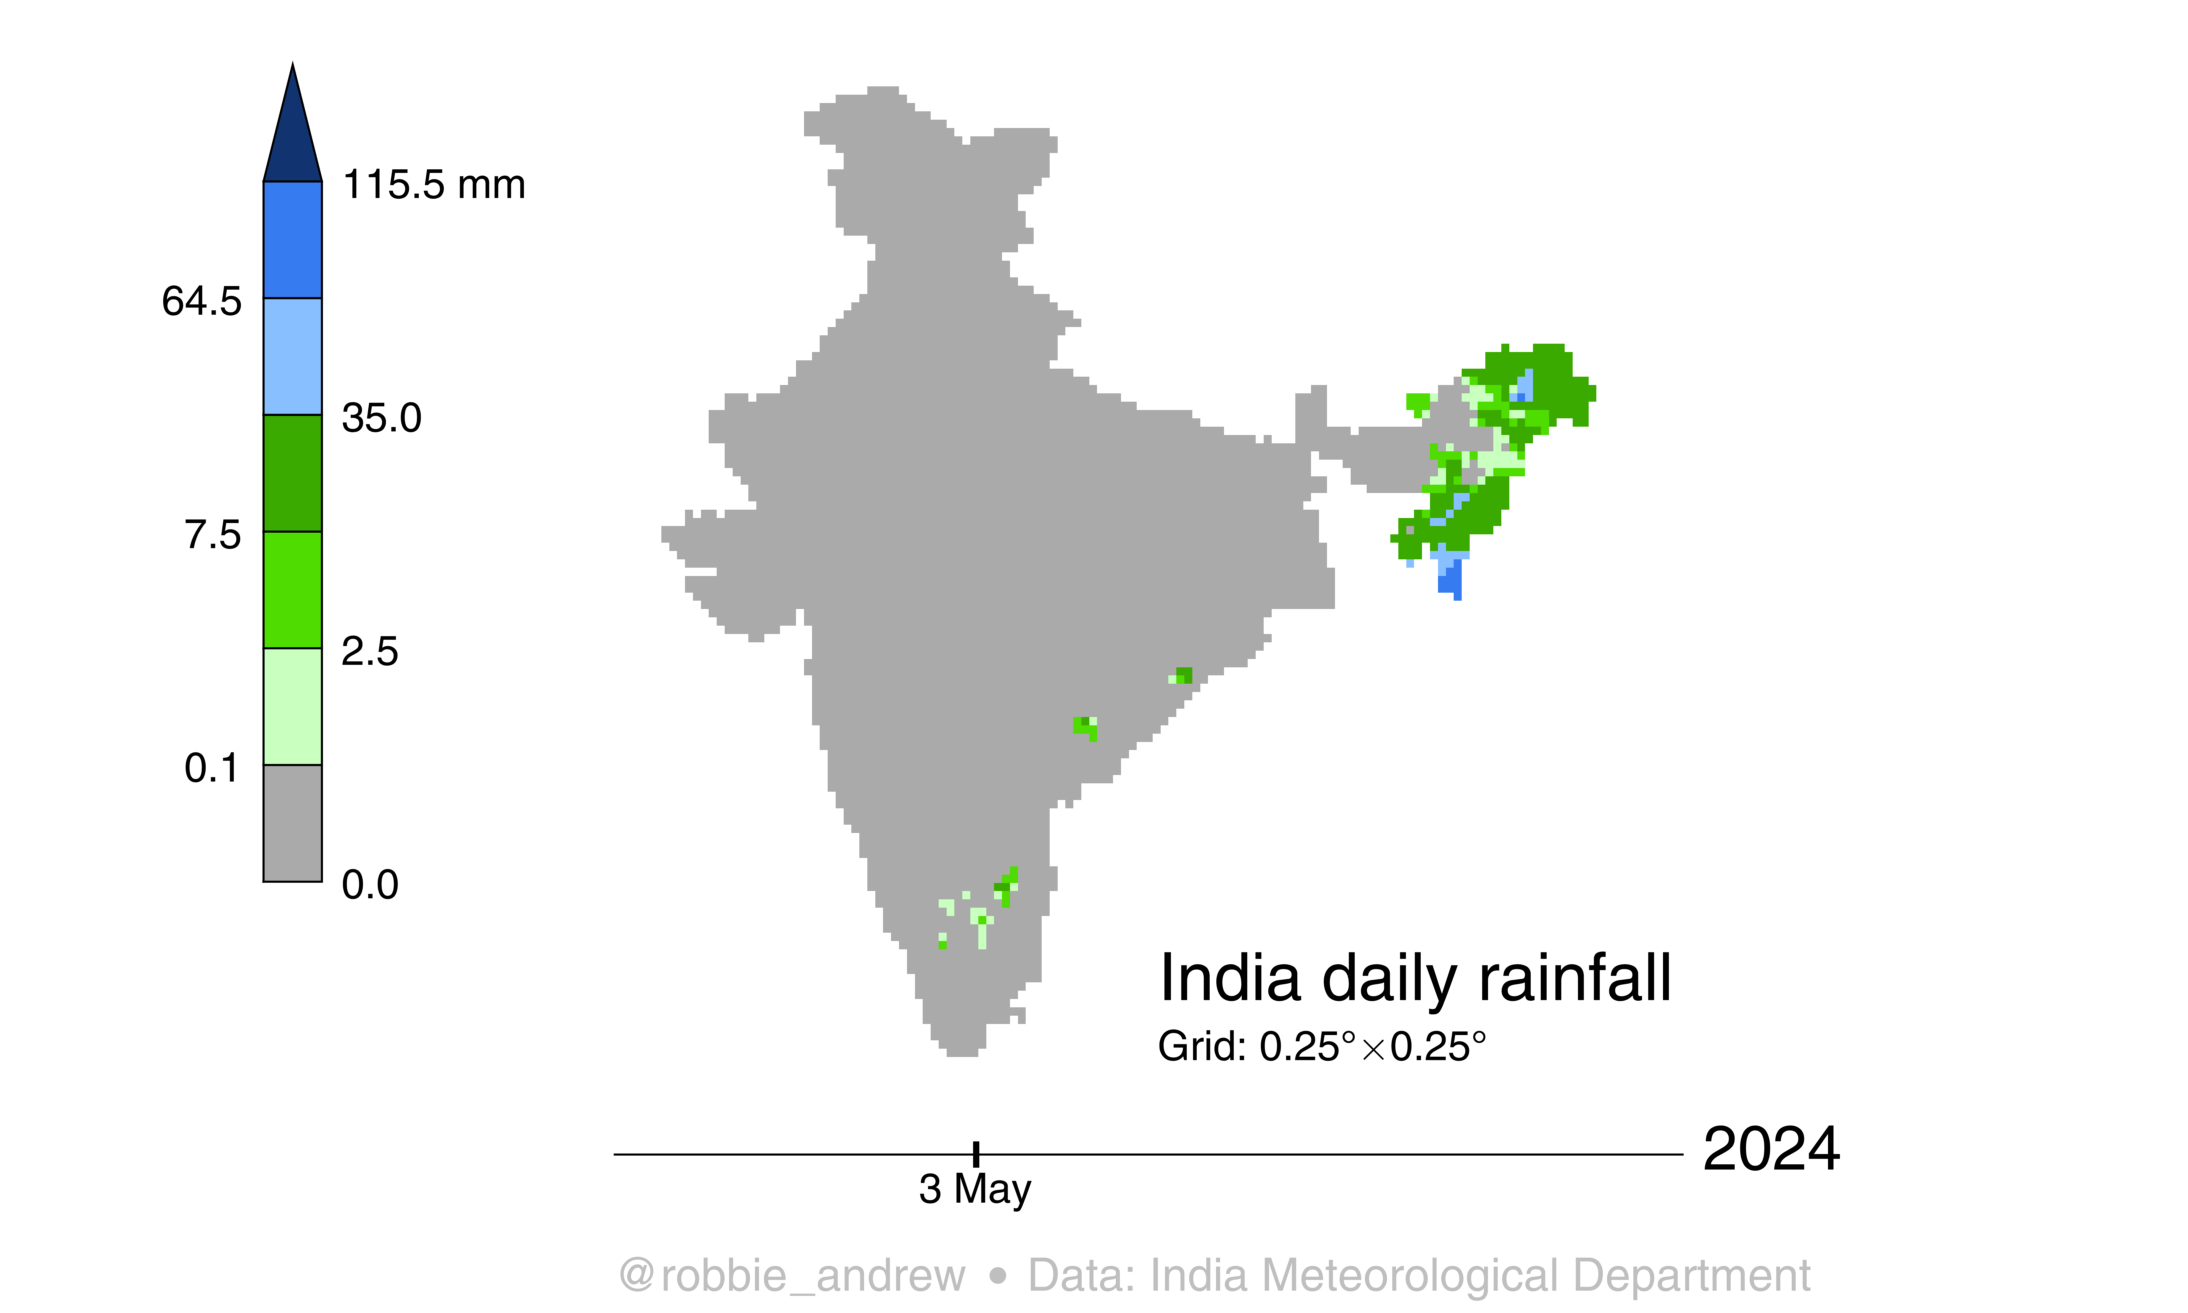
Accumulated Rainfall (Precipitation) in the last 24 hours - Gridded Daily Totals from Indian Meteorological Department
Precipitation (rainfall) and 2m-Temperature forecast for the next 3-days (India and the Sub-Continent)
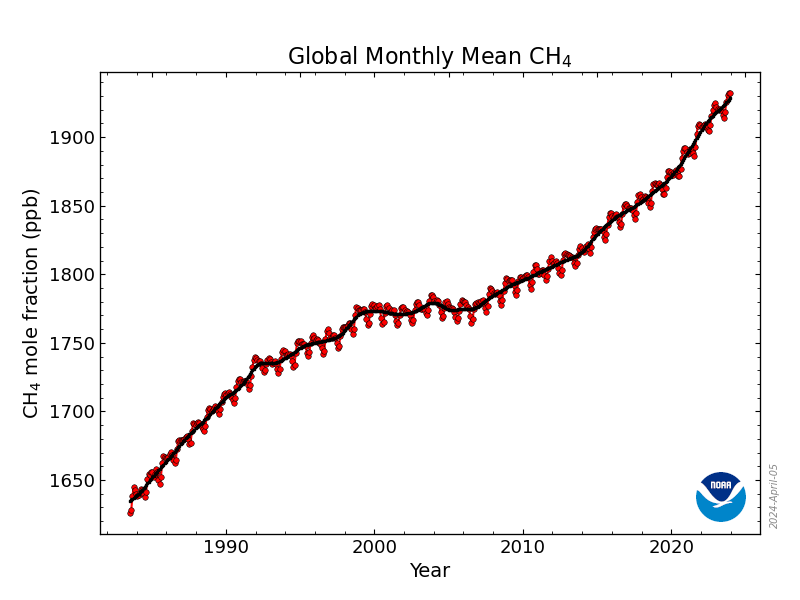
Data Resource - Climate Trends - Global Methane Monthly Means
Direct Article Link or click on the image below.
Journal Article - Fixing Bangladesh's power sector
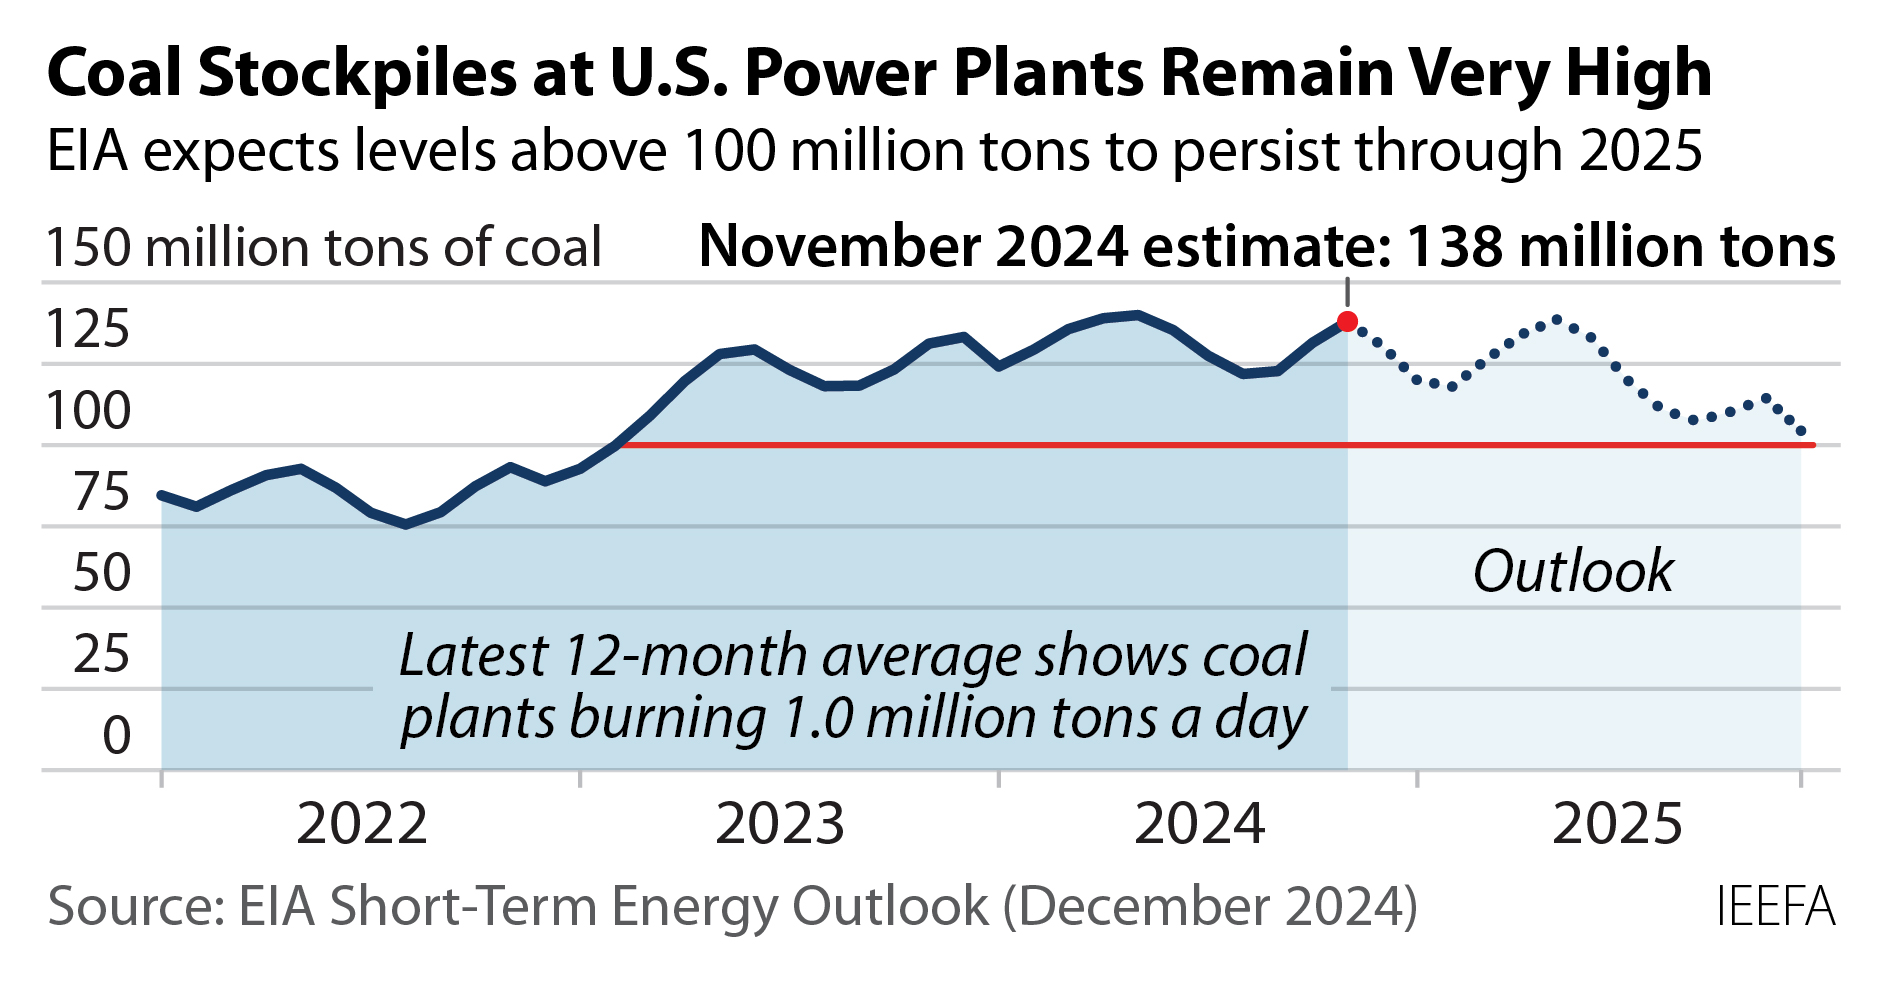
Journal Article - Mountain of coal at U.S. power plants a new threat to coal industry
Direct Article Link or click on the image below.
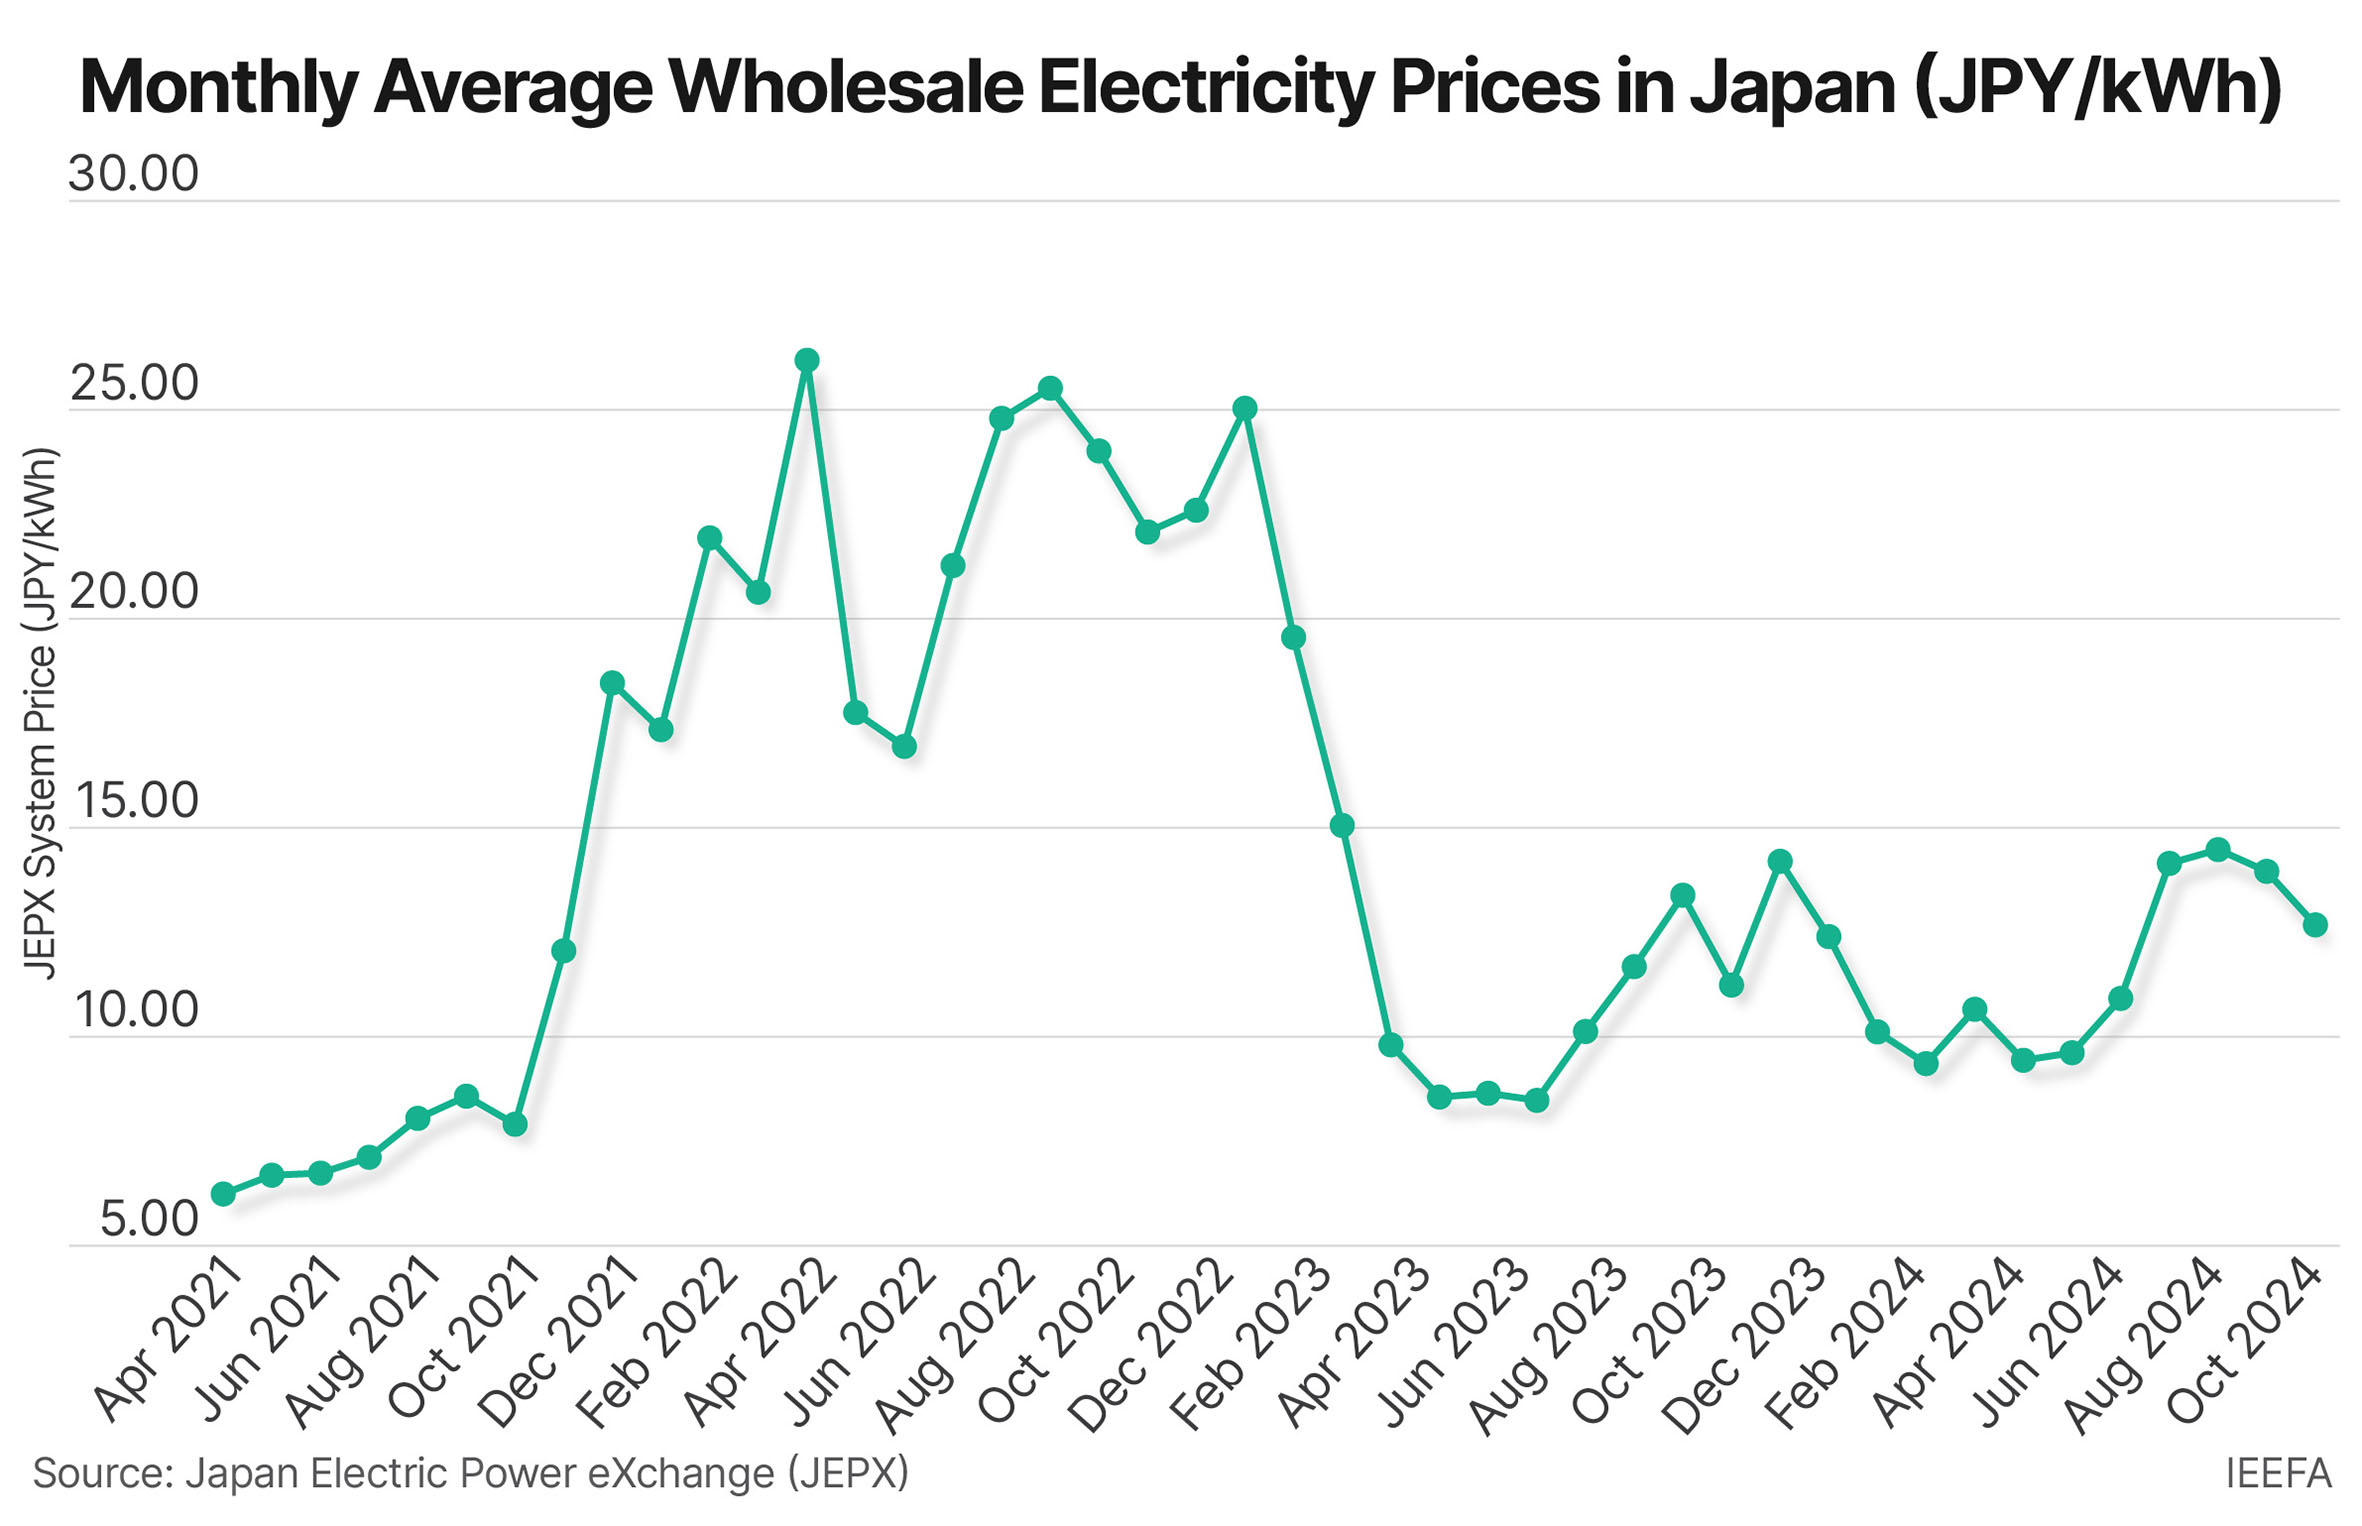
Op-Ed - The clean energy transition is an economic imperative for Japan’s new government
Direct Article Link or click on the image below.
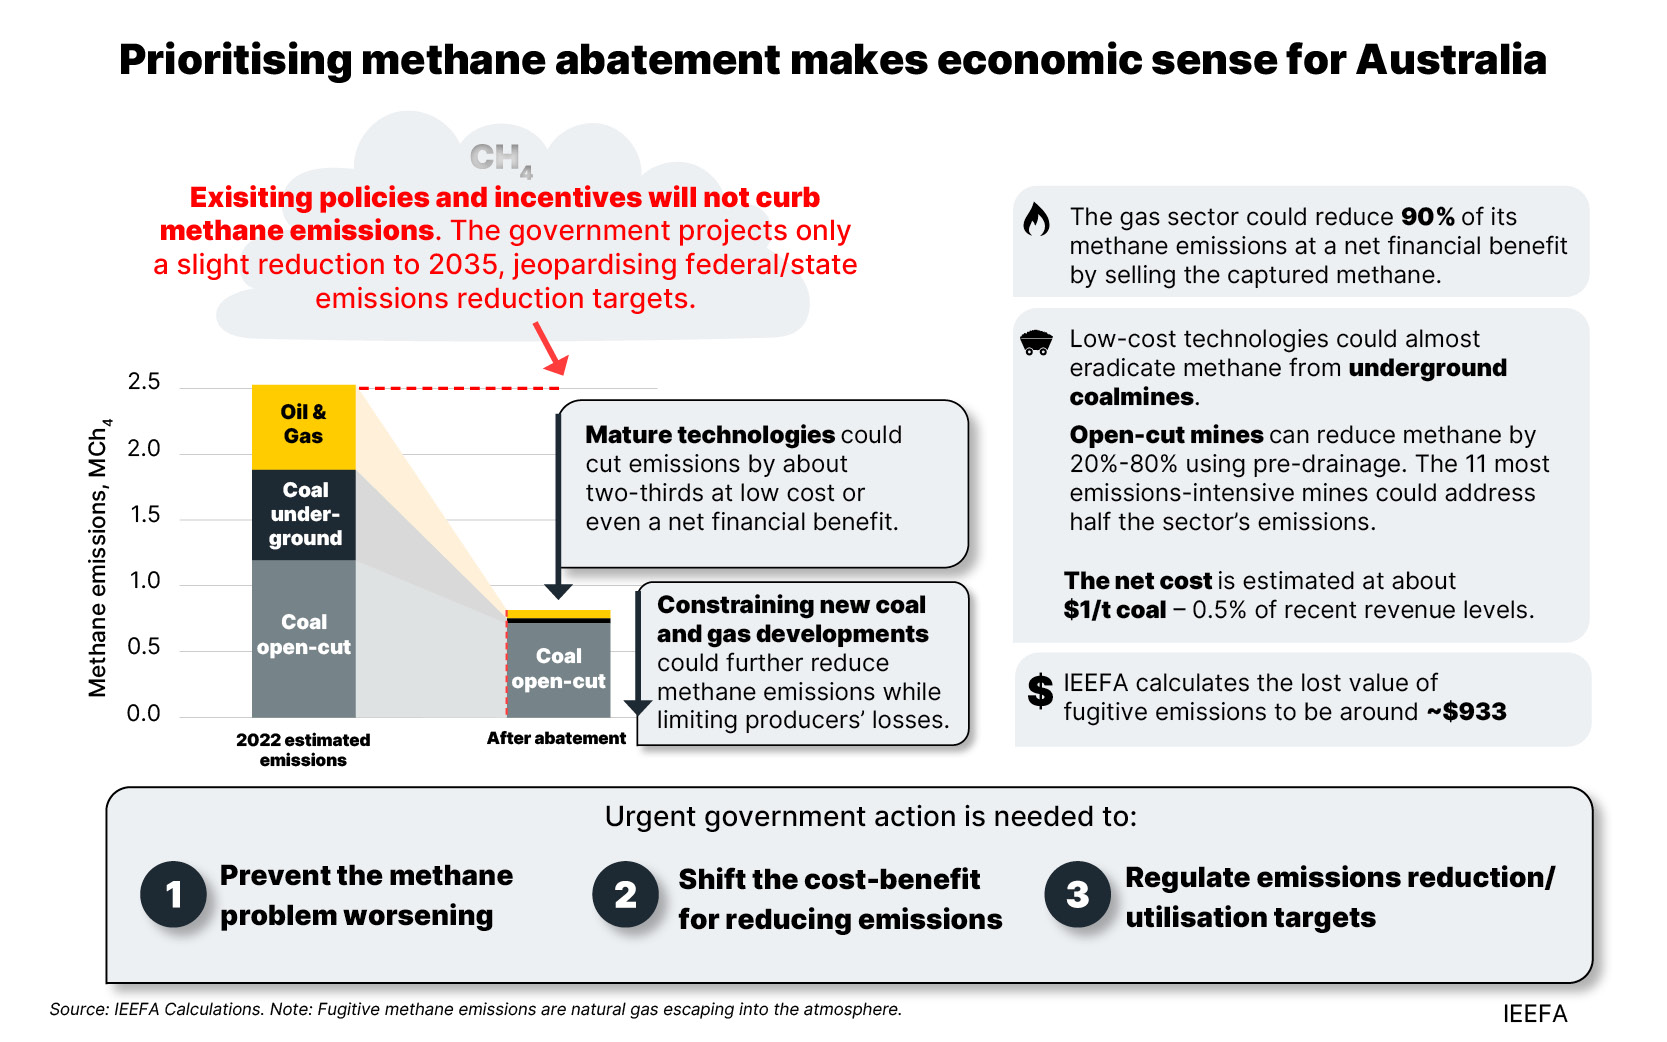
Op-Ed - Prioritising methane abatement makes economic sense
Direct Article Link or click on the image below.
Journal Article - AI weatherman: the DeepMind researcher making faster, more accurate forecasts
Direct Article Link or click on the image below.

Journal Article - Short-Lived Air Pollutants and Climate Forcers Through the Lens of the COVID-19 Pandemic
Thursday, December 19, 2024
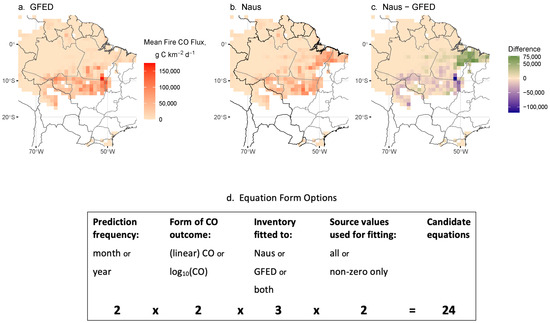
Journal Article - Equations to Predict Carbon Monoxide Emissions from Amazon Rainforest Fires
Direct Article Link or click on the image below.
Op-Ed - How the UK plans to reach clean power by 2030
Direct Article Link or click on the image below.

Car Culture - Cars in Australian cities are emitting less – but in the regions exhaust emissions are growing
Direct Article Link or click on the image below.

Health Impacts - New research links sulfur dioxide pollution with depression
Direct Article Link or click on the image below.

Op-Ed - Insurers Are Deserting Homeowners as Climate Shocks Worsen
Direct Article Link or click on the image below.

Humor in Pollution - No packing necessary — Japan Airlines’ pushes ‘rental clothes’ to travelers at their destination
Direct Article Link or click on the image below.

Op-Ed - Pakistan and Bahamas join push for global pact to phase out fossil fuels
Direct Article Link or click on the image below.

Journal Article - To Monitor Greenhouse Gas Emissions Nationwide, U.S. Enlists Passenger Plane
Direct Article Link or click on the image below.

Op-Ed - LISTEN: Reflections on the first five years of the Agents of Change program
Direct Article Link or click on the image below.

Op-Ed - Alert fatigue: The phrase that defined our climate in 2024
Direct Article Link or click on the image below.

Humor in Pollution - How Delhi Copes with the Air Crisis
Direct Article Link or click on the image below.

Tuesday, December 17, 2024
Precipitation (rainfall) forecasts for the next 3 days - Chennai, India
Precipitation (rainfall) forecasts for the next 3 days - Goa, India
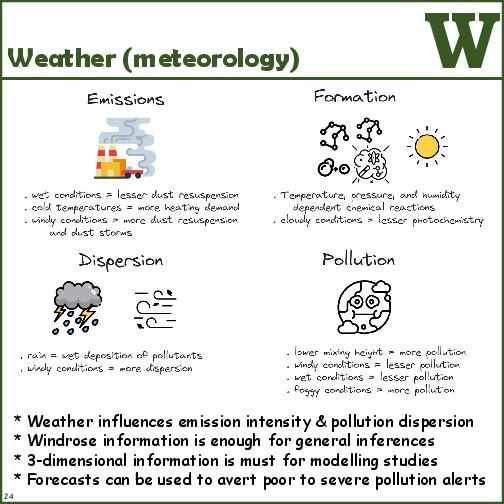
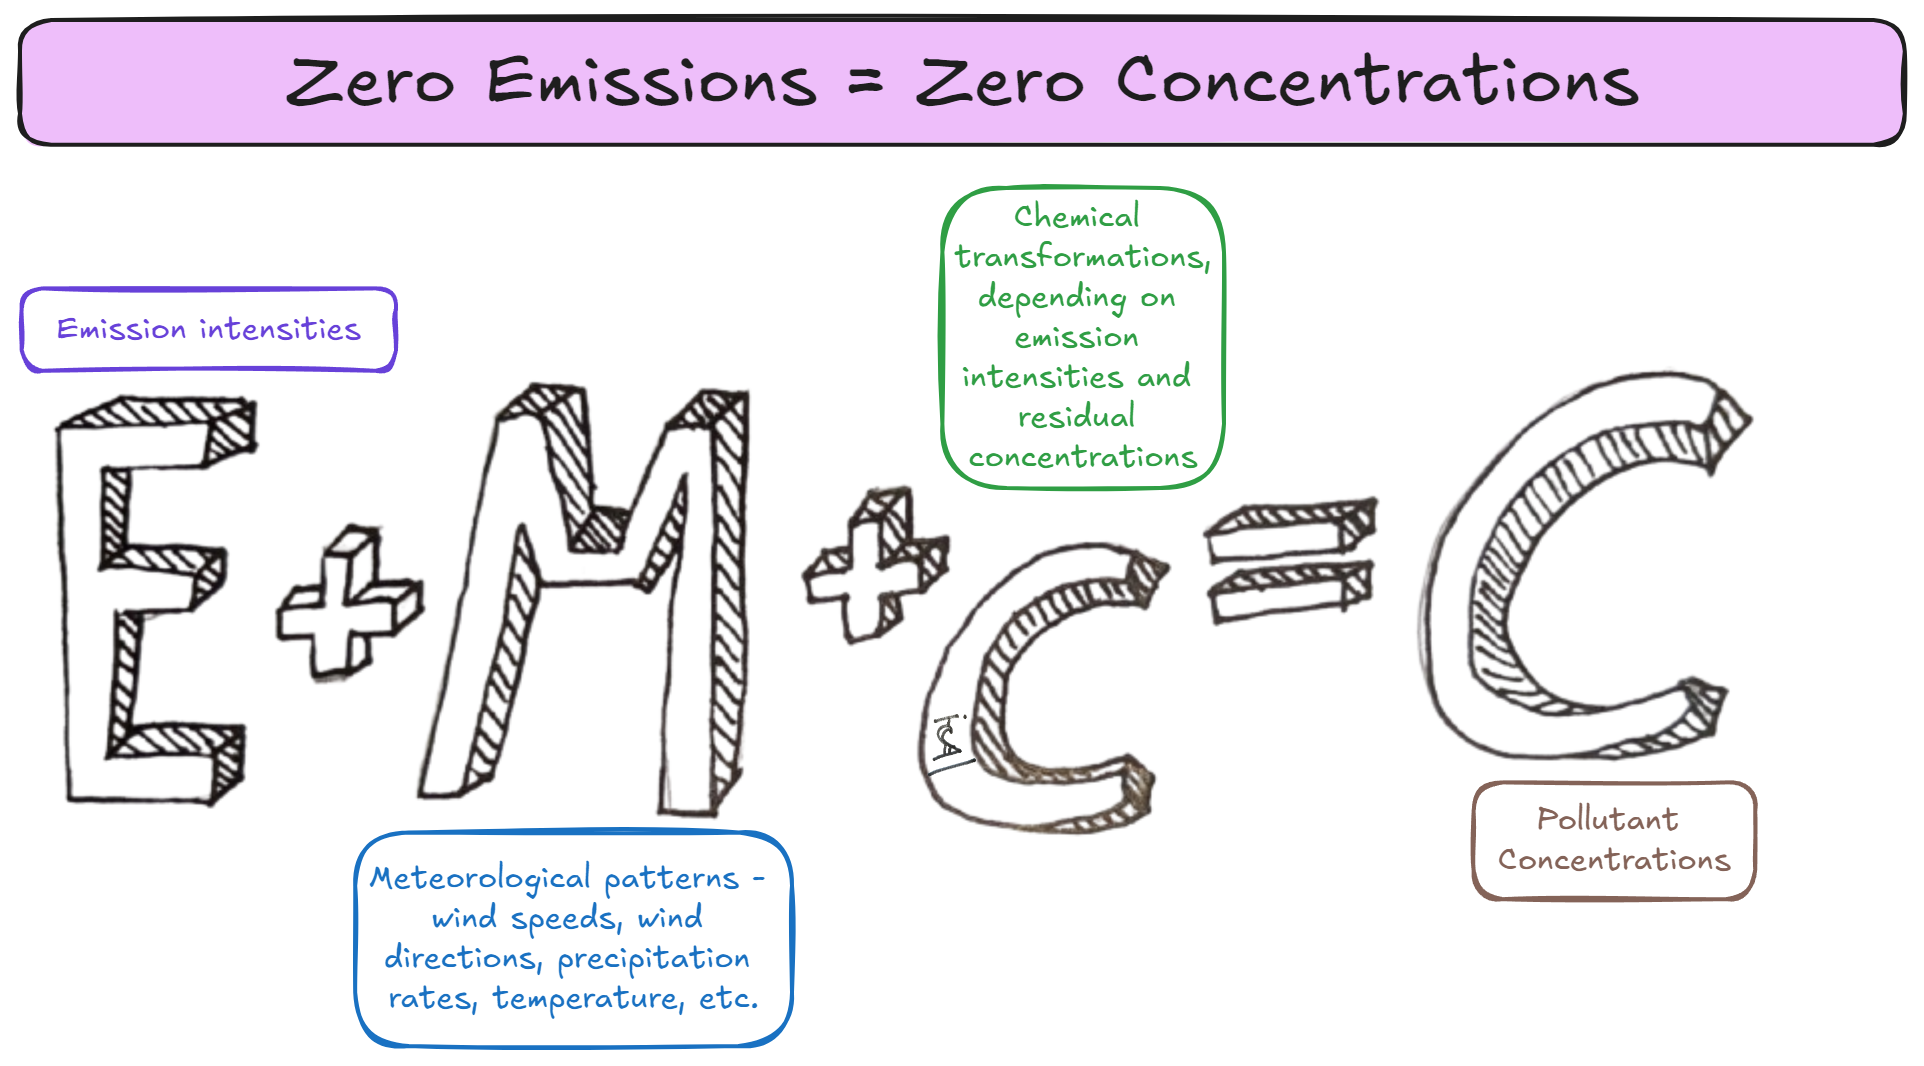
Can We Benefit from Blaming Meteorology for Air Pollution Problems?
